The growing number of APIs in an application network introduces a difficult complexity in identifying the system’s API gaps. It increases the time to identify the issue and resolution time, resulting in poor customer experience and, in many cases, revenue loss. To overcome these challenges, it’s crucial to constantly monitor and analyze the transactional and operational data at individual and end-to-end transactions.
The APIs that form API networks require greater visibility regarding API conditions, real-time insights, and more in-depth information about each API to deliver a better digital experience. These items will help proactively identify the issues, diagnose the problem, and prevent any more significant loss.
The MuleSoft Anypoint Monitoring platform provides API visibility using dashboards, event-driven alerting and functional monitoring, logging systems, and a visualizer to help the developer and operational team continuously get feedback from the APIs and thereby ensuring reliability and stability.
API Dashboards in Anypoint Monitoring
The dashboards in Anypoint Monitoring help users understand how the APIs are performing, consumed, and utilized in various environments. Anypoint Monitoring provides the default built-in dashboards and customizable dashboards for advanced analytics. The dashboards provide the operational and transactional metrics on the APIs. Operational and development teams use the dashboards to identify bottlenecks, diagnose issues, and prescribe solutions to behavior that negatively impacts the state and performance of the API.
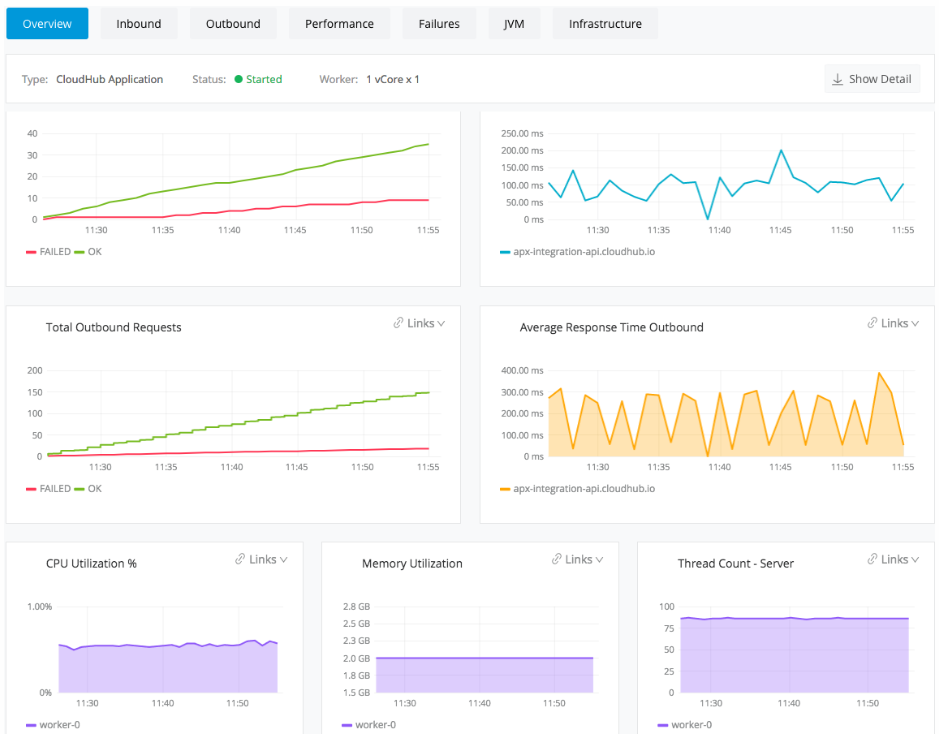
The built-in dashboards contain graphs, charts, and single-stat tables, which provide an aggregate view of the API usage, utilization, and performance. They also give an overall count on inbound calls, outbound responses, the number of failures on the API calls, and JVM and infrastructure metrics.
One of the major strong points of Anypoint Monitoring is that it offers users the ability to customize the monitoring with individualized dashboards, metrics, and query builders. The custom dashboards let us configure visibility to show request data, response codes, and policy violations, for example, which provide valuable information on an API’s transactional and operational data.
Event-Driven Alerts for Anypoint Monitoring

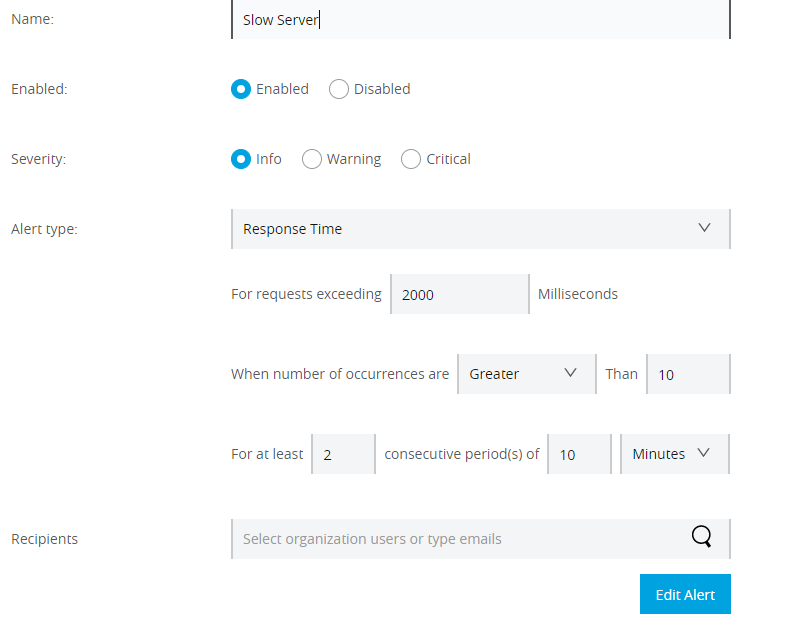
Event-driven alerts allow us to configure alerts and notifications based on specific criteria — for example, if the API exceeds a defined threshold on a particular or combination of metrics. The event-driven alerts enable us to proactively identify anomalies in API behavior and help developers identify and take action before the issue creates adverse effects on the application network. The alerts can be configured for API Operational Alerts and Runtime Operational Alerts on Applications and Servers.
API Functional Anypoint Monitoring
The API Functional Monitoring helps schedule functional tests to run continuously against API endpoints at regular intervals in both production and non-production environments. The constant testing of an API’s functional behavior ensures the quality and reliability of public and private APIs in application networks. Functional monitoring helps identify the current state of an API while also giving insight into the functional behavior.
Functional Monitoring helps developers carry out the following tasks:
- White-box testing: Validates the behavior of individual APIs against the understanding of how their internals work.
- Black box testing: Validates the overall behavior of an API without knowing or altering the API internals.
- Runtime Monitoring: Ensures that deployed APIs are operating and performing as expected.

Anypoint Monitoring Logging System:
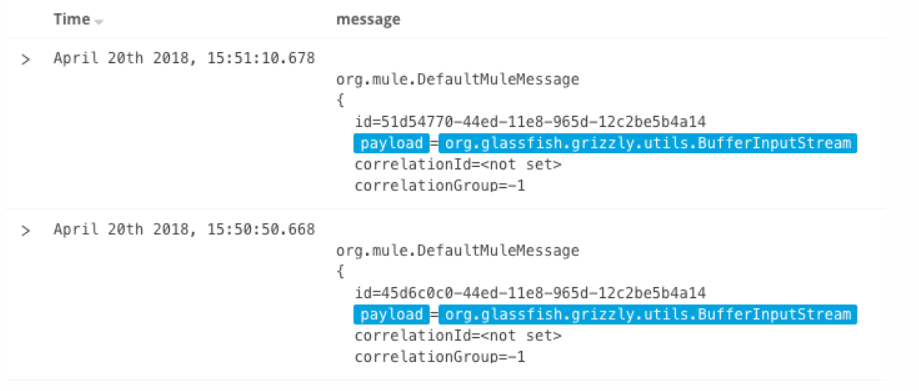
The Logging system in Anypoint Monitoring aggregates the log files. It facilitates distributed log searches of event data across application networks to pinpoint the root cause of a problem.
The log aggregator system holds raw operation data and records events in the operating system or Mule app. Log aggregation compiles, organizes, and indexes log files to facilitate the management, searching, and analysis of API data. Aggregated logs complement the monitoring system by helping you identify the causes of operational issues and investigate failures.
Anypoint Visualizer
Anypoint Visualizer provides high-level graphical visualization of application networks. It gives the real-time graphical representation of APIs that are running and discoverable. The data displayed in the graph is dynamically updated, showing the connections between APIs based on the traffic between applications. The Anypoint Visualization shows the visibility of the API invocation hierarchy in the API-Led connectivity, which helps in understanding the architecture and dependencies between APIs in the application network. The APIs in the Visualizer can be overlayed in the system, process, and experience layers to help identify the layer that the API belongs to. However, the names of layers can be changed using the labels on the APIs.
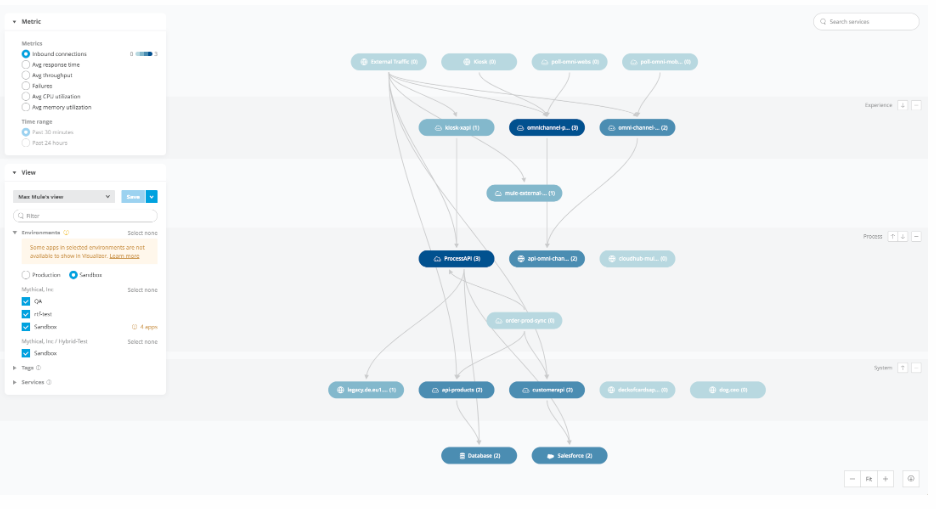
From the Anypoint Visualizer, we can inspect the performance metrics, and policy information, and arrange APIs in layers and node connections.

In conclusion, API Monitoring, along with the Anypoint Visualizer, provides greater visibility into the API network and helps the enterprise proactively identify and diagnose problems to take corrective steps in preventing losses to the business.
Interested in leveraging Mulesoft’s Anypoint Monitoring, Visualizer, or any other MuleSoft technology? Contact us today to discuss how to get started! Interested in more MuleSoft information? Check out our MuleSoft blog.