INNOVATIONS: XTIVIA DASHBOARD FRAMEWORK
Overview
Need to build BI dashboards on Liferay, but struggling to find a product that truly integrates with Liferay?Hoping to leverage your Liferay investment in terms of identity management, access control dynamic page aggregation? Do you have an enterprise or departmental star schema data warehouse containing all kinds of useful Key Performance Indicator (KPI) data that you want to surface to your portal users? If so, XTIVIA has a solution for you.
Why XTIVIA Dashboard Framework
Many enterprise IT environments have a need for “dashboards” that provide integrated, highly visual (e.g., chart-driven) representations of key data to executives, analysts and key decision makers. In addition to the data visualization requirements for these dashboards, there are typically security requirements (role-based access control) around “who can see what”.
There are a number of products available in the marketplace today that support the development of such dashboards. However, there are limitations associated with building these dashboards with these “dashboard-only” types of products:
1. The created dashboards are often generated in a stand-alone manner, and are not easily integrated with other key MIS systems in use;
2. The implementation of the security requirements often requires the development of multiple instances of the dashboard where the security/access requirements are statically “baked in,” or assigned to each unique instance.
One of the great strengths of any portal server, and Liferay in particular, is the ease with which it can accomplish “at the glass” data integration and human collaboration across the entire enterprise. Typically, we think of this integration in terms of traditional portlet “applications” (e.g., forms, lists, tables, etc.), but XTIVIA has developed a solution framework that shows how Liferay can also be used to develop powerful dashboard applications that are portlet-based, configuration-driven (XML), and equivalent in capability to those typically developed with standalone dashboard products. This provides a powerful metaphor for integrating the analytics of dashboards with the collaboration features of the portal environment.
Key Features
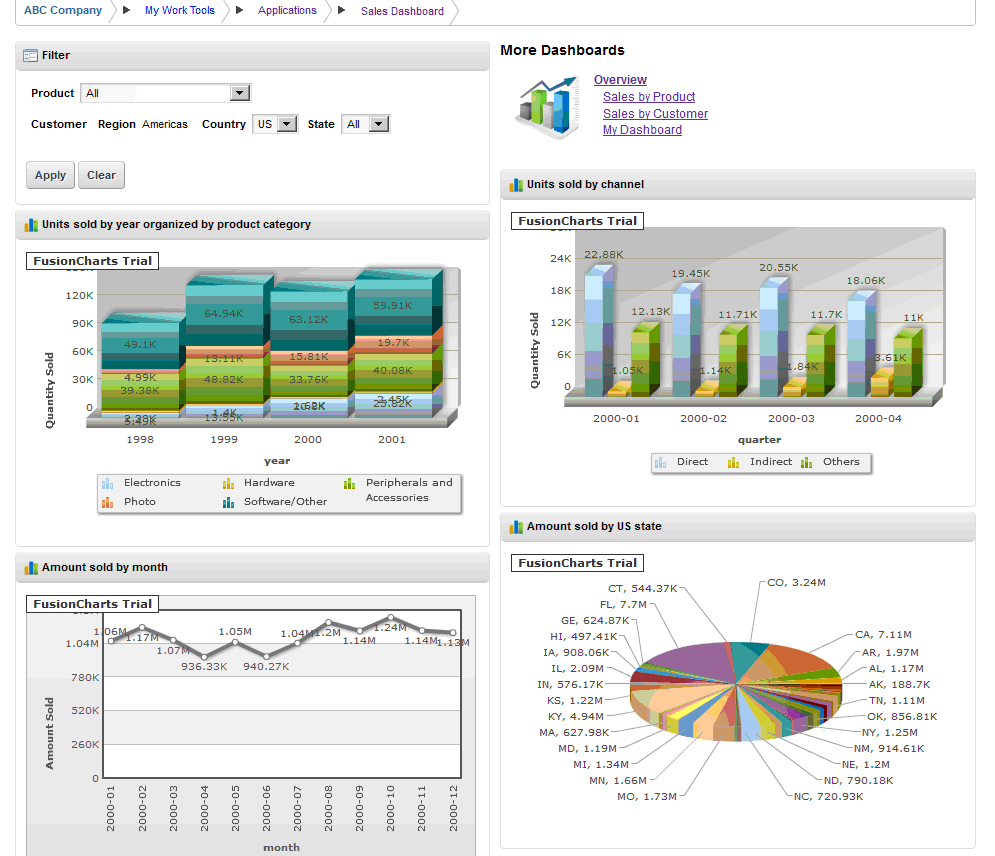
The XTIVIA Dashboard provides natural integration into your portal, without a separate website or additional login to remember. Each metric can be displayed in many different chart formats, such as column, line, pie, bar, area, stacked bar, and stacked column. When drill-down is enabled for a chart, clicking on the chart will display the appropriate data in an entirely different format, if desired. The user can rearrange charts on the page using drag-and-drop technology, as well as resize individual charts. Any number of metrics can be displayed, and you can create templates for different user categories and security restrictions. In addition, filters can be applied to all the charts on a page, so that the data can be based on part of the organization or a geographic area.
The XTIVIA Dashboard is a framework of JSR-168/286 portlets to configure, filter, and display data. The framework has been designed to require very little technical support. The filter and display portlets can be used without modification, but can also be customized for specific organizational requirements. Most of the framework configuration involves developing a connection to your data warehouse. Coupled with an XML description of the data, the framework automatically creates a REST service to provide the data. All other configuration can be achieved through the portlet user interface.
For a more in-depth rundown of the features, read more here.
FAQ
Q: The Dashboard is great! How do I get it?
A: The Dashboard framework is available to XTIVIA customers as a perpetual, unlimited license with an up-front licensing cost. Please contact your XTIVIA representative or request more information via [email protected].
Q: Is the source code available?
A: The Dashboard framework source code is provided to XTIVIA customers under the LGPL license.
Q: What is a star-schema?
A: For a short tutorial, click here.
Q: Can I modify the provided source code to meet my needs?
A: Yes, you can modify the code as much as you want.
Q: How do I deploy the framework?
A: The framework consists of portlets, so you deploy and control the framework as you would other portlets.
Q: How do I personalize the framework to display different results for different users?
A: For an in-depth discussion, see Personalization and Security.
Q: I don’t have any developers available, or they don’t have expertise in this area. Can I get some help?
A: XTIVIA is happy to help! Please contact your XTIVIA representative or request more information via [email protected].
Q: My data doesn’t fit the star-schema model. Can I still use the Dashboard framework?
A: Yes! While the framework easily works with a star-schema data model, it’s not required. You can tailor the framework to work from a spreadsheet or whatever data model works for you.
Documentation
You can find the product documentation here.Let's Talk Today!
XTIVIA CORPORATE OFFICE
304 South 8th Street, Suite 201
Colorado Springs, CO 80905 USA
Additional offices in New York, New Jersey,
Missouri, Texas, Virginia, and Hyderabad, India.
USA toll free: 888-685-3101, ext. 2
International: +1 719-685-3100, ext. 2
Fax: +1 719-685-3400
XTIVIA needs the contact information you provide to us to contact you about our products and services. You may unsubscribe from these communications at anytime, read our Privacy Policy here.