There are many tools for monitoring applications. One that we may want to use is JAMon, the Java Application Monitor; it can be really useful for discovering what the hell is going on in our application. We are going to view a quick introduce in it.
But first, a little words about JAMon.


I think that’s not the
JAMon I’m talking about…
This tool can be used to monitor applications in production, testing or Q & A phases. With JAMon it is possible …
- … to ensure the application meets its performance requirements.
- … to ensure the application meets its scalability requirements.
- … to detect if the application has any errors or throws unwanted exceptions.
- … to ensure that that all parts of the application were properly tested (coverage).
- … to ensure that the application is properly working in production as part of post-production testing.
- … to gather information from production and start a feedback loop between development, test and production that will improve the application
In this post we are going to see how to use JAMon to monitor the queries that Liferay executes, in a really easy way. We are going to use Liferay 6.1, Tomcat, MySQL and JAMon 2.74, but it is really similar with other versions.
Follow these steps:
- Download the last version of JAMon.
- Unzip and copy
- jamon.war into tomcatwebapps
- jamon-2.74.jar into tomcatlibext
- Modify portal-ext.propertiesreplace
jdbc.default.driverClassName=com.mysql.jdbc.Driver
jdbc.default.url=jdbc:mysql://localhost/demo?useUnicode=true&characterEncoding=UTF-8&useFastDateParsing=false
with
jdbc.default.driverClassName=com.jamonapi.proxy.JAMonDriver
jdbc.default.url=jdbc:mysql://localhost/demo?jamonrealdriver=com.mysql.jdbc.Driver&useUnicode=true&characterEncoding=UTF-8&useFastDateParsing=falsePlease note that we are using the schema “demo” in localhost - Start Tomcat
- Go to http://localhost:8080. You will be able to login, see pages, etc. as usual.
- Go to http://localhost:8080/jamon. You will see a page like this:
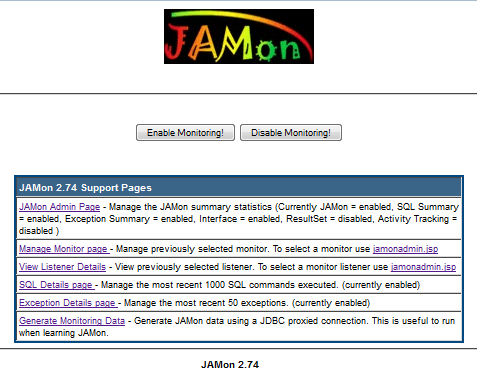
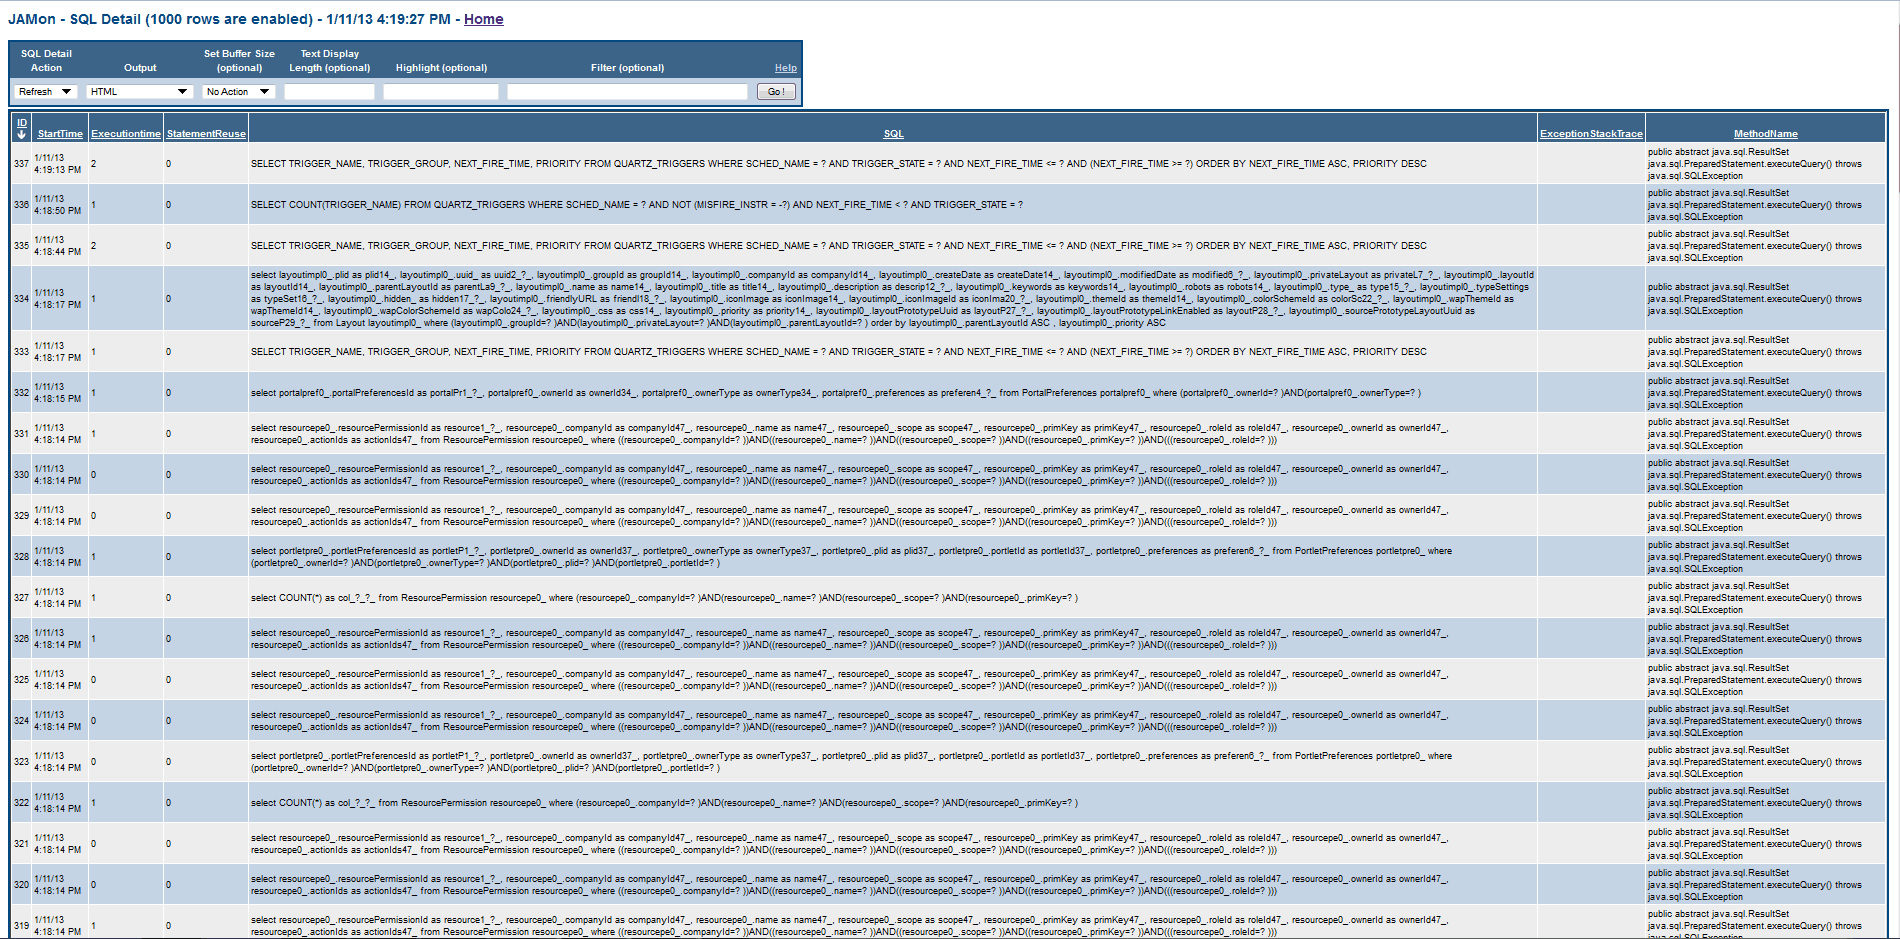
We are going to ignore all the options except SQL details page. In this section, we are going to be able to view every executed SQL, the start time, execution time, etc.
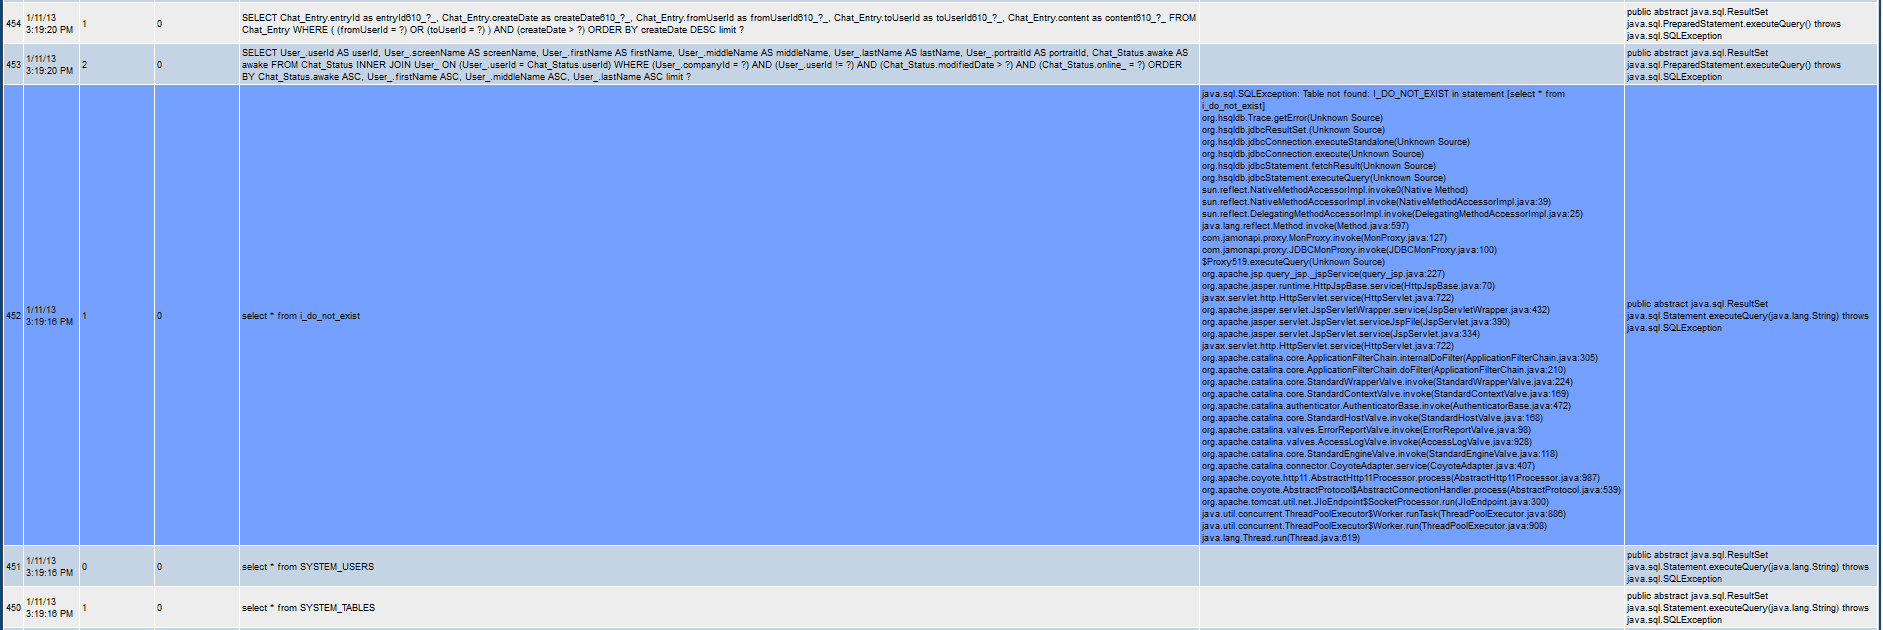
Also, is possible to use JAMon to detect if the application has any errors or throws unwanted exceptions. If the JAMon JDBC driver is used, all SQL exceptions will show up in the JAMon reports regardless if the exceptions are re-thrown or not.
Note that JAMon allows ANY vendors JDBC driver to be monitored (Sybase, SQL Server, Oracle, MySQL, HSQLDB, etc), and the JAMon JDBC driver allows developers to monitor JDBC/SQL without changing any code.