This guide will show you how to format a Jfreechart (Chart) in Jasper Studio, change the cast type from “double” to “string” and display percent as a chart Label.
The JFreeChart project was founded in February 2000 by David Gilbert. JFreeChart is a free, open-source Java framework and has become the most widely used chart library for Java. This has allowed for the creation of a wide variety of both interactive and non-interactive charts. JFreeChart supports combined charts: X-Y charts (line, spline, scatter, and time axis), pie charts, gantt charts, bar charts (horizontal and vertical, stacked, and independent), and and histogram plotting. JFreeChart also supports single-valued (thermometer, compass, speedometer) that can then be placed over map, and various specific charts (wind chart, polar chart, and bubbles of varying size). JFreeChart also supports GNU Classpath.
JFreeChart features also include a flexible design, a consistent API, and targets both server-side and client-side applications. JFreeChart supports many output types such as image files, vector graphic file formats, and Swing and JavaFX components. JFreeChart has made it easy for developers to display professional quality charts in their applications.
Here’s how to begin formatting a JFreechart in Jasper Studio :
Launch Jasper Studio
Go to Pallet and Select Chart.
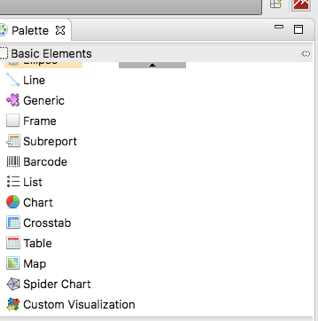
Drag and Drop a Bar Chart
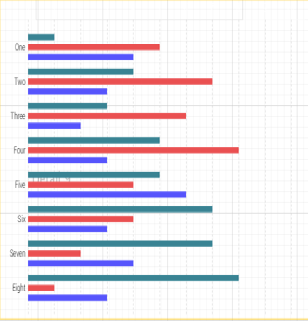
Double Click the Chart to go to Chart configurations.
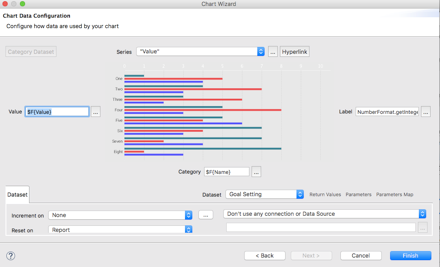
Select Your Series and Values you want to Display and Go to Label
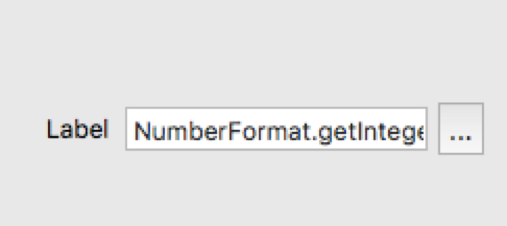
Open the Label Expression Editor and format it
Here we will convert a value with Cast type Double to String and add a percent at the end
With the following Expression( Your data cast type will depend on data selected).
NumberFormat.getIntegerInstance().format($F{Value}).toString()+" %"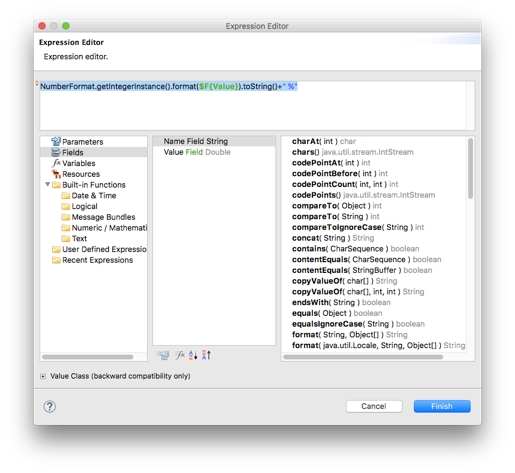
Now Click Finish.
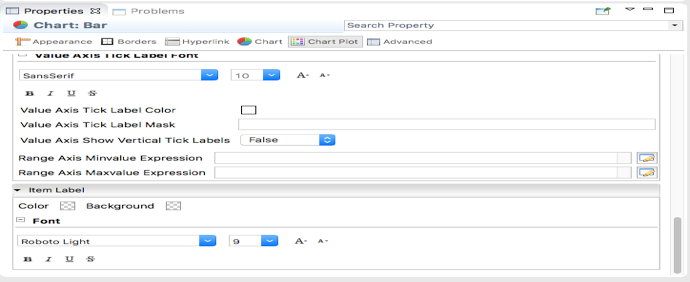
You can customize this chart more by clicking on chart properties window.
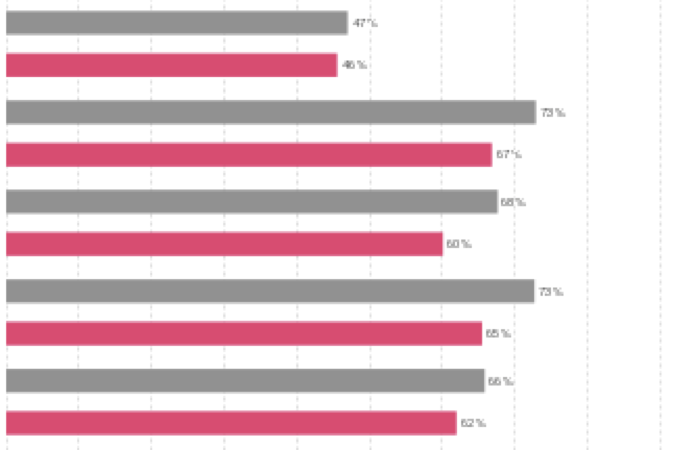
You can deploy this Report to Jasperserver or run in Jasper Studio. Your Results will look as follows.