
You may have noticed that more organizations have started moving towards the containerization of their applications. Many of these organizations are using Kubernetes as the backbone for their container environments. As an organization’s Kubernetes environment gets more complex, getting visibility into the environment’s performance is a critical item. Enter Prometheus and Grafana; by leveraging these tools, you get a very in-depth view of how the overall environment is performing. The beauty of using these tools is that they offer visibility at varying levels into the infrastructure. Grafana can also be leveraged for alerting based on statistics, which we will cover in a subsequent blog post.
Setup Helm: The Definitive Guide to Setting Up Prometheus with Grafana Integration for EKS
The installation of Prometheus and Grafana is simplified by using Helm. Setting up Helm is pretty straightforward.
On a Mac, running brew install helm will install helm using homebrew.
On a Windows desktop choco install kubernetes-helm will install Helm.
You can also install Helm manually using the following steps:
- Download your desired version
- Unpack it (tar -zxvf helm-v3.0.0-linux-amd64.tar.gz)
- Find the helm binary in the unpacked directory, and move it to its desired destination (
mv linux-amd64/helm /usr/local/bin/helm)
Setup Prometheus: The Definitive Guide to Setting Up Prometheus with Grafana Integration for EKS
Setting up Prometheus in your EKS cluster can be done with one straightforward command. Note that the following command will install the application in the “prometheus” namespace. It’s considered a best practice to set up a separate namespace for Prometheus for easy management.
bash-3.2$ kubectl create namespace prometheus
bash-3.2$ helm install stable/prometheus --namespace prometheus --set alertmanager.persistentVolume.storageClass="gp2",server.persistentVolume.storageClass="gp2" --generate-name
When the command runs successfully, you will see output similar to the following:
NAME: prometheus-1234567890
LAST DEPLOYED: Wed Nov 20 18:03:05 2019
NAMESPACE: prometheus
STATUS: deployed
REVISION: 1
TEST SUITE: None
NOTES:
The Prometheus server can be accessed via port 80 on the following DNS name from within your cluster:
prometheus-1234567890-server.prometheus.svc.cluster.local
You will also be provided with additional information for troubleshooting the application setup; this information can be helpful for setting up integration with other applications.
Get the Prometheus server URL by running these commands in the same shell:
  export POD_NAME=$(kubectl get pods --namespace prometheus -l "app=prometheus,component=server" -o jsonpath="{.items[0].metadata.name}")
  kubectl --namespace prometheus port-forward $POD_NAME 9090
The Prometheus alertmanager can be accessed via port 80 on the following DNS name from within your cluster:
prometheus-1234567890-alertmanager.prometheus.svc.cluster.local
Get the Alertmanager URL by running these commands in the same shell:
  export POD_NAME=$(kubectl get pods --namespace prometheus -l "app=prometheus,component=alertmanager" -o jsonpath="{.items[0].metadata.name}")
  kubectl --namespace prometheus port-forward $POD_NAME 9093
#################################################################################
######   WARNING: Pod Security Policy has been moved to a global property.  #####
######            use .Values.podSecurityPolicy.enabled with pod-based      #####
######            annotations                                               #####
######            (e.g. .Values.nodeExporter.podSecurityPolicy.annotations) #####
#################################################################################
The Prometheus PushGateway can be accessed via port 9091 on the following DNS name from within your cluster:
prometheus-1234567890-pushgateway.prometheus.svc.cluster.local
Get the PushGateway URL by running these commands in the same shell:
  export POD_NAME=$(kubectl get pods --namespace prometheus -l "app=prometheus,component=pushgateway" -o jsonpath="{.items[0].metadata.name}")
  kubectl --namespace prometheus port-forward $POD_NAME 9091
For more information on running Prometheus, visit: https://prometheus.io/
Note: You can retrieve information about the Prometheus endpoint after setup is complete by using the following command:
bash-3.2$ kubectl get svc -o wide -n prometheus
> prometheus-1234567890-server.prometheus.svc.cluster.local
In the next section, we will use the Prometheus endpoint to integrate with Grafana.
Setup Grafana: The Definitive Guide to Setting Up Prometheus with Grafana Integration for EKS
Before setting up Grafana, you need to make a few architectural considerations such as:
- Will you use Grafana for alerting?
- Do you need the data to be persistent?
- Do you need Grafana to support SSO?
Grafana uses emails for alerting. Please note that it’s easier to create the configuration during the initial setup so that you don’t have to re-execute the setup process later down the line.
Alerting
Create a json file in the directory where you will be running the helm install command from to setup Grafana. Call this file grafana-smtp.json with the following content. Save and exit. We will use this file during Grafana setup.
{ "grafana.ini": { "smtp": { "enabled": true, "host" :"smtp.host.net:port", "user" : "userid", "password" : "password" }}}Root URL
Create another json file where you will be running the helm install command from. Call this file grafana-server.json with the following content. Save and exit. We will use this file during the Grafana setup. This configuration is important because this is considered the “redirect” URL when setting up SSO.
{ "grafana.ini": { "server": { "root_url" : "https://grafana.dns.com/" }}}OAuth2 (GitHub)
Please note that Grafana can be integrated with multiple authentication providers. For setting up OAuth, we’re using GitHub as an example. For additional examples, please refer to the following webpage: https://grafana.com/docs/grafana/latest/auth/overview/
Configure GitHub OAuth application
First, you need to create a GitHub OAuth application (you can find this under the GitHub settings page). When you create the application you will need to specify a callback URL; specify this as the callback:
http://<my_grafana_server_name_or_ip>:<grafana_server_port>/login/github
This callback URL must match the full HTTP address that you use in your browser to access Grafana, but with the prefix path of /login/github. When the GitHub OAuth application is created, you will get a Client ID and a Client Secret. Specify these in the Grafana configuration file. Create a json file in the directory where you will be running the helm install command from. Call this file grafana-auth.json with the following content. Save and exit. We will use this file during the Grafana setup.
{ "grafana.ini": { "auth.github": { "enabled" : true,"allow_sign_up" : true, "client_id" : "ClientID", "client_secret" : "ClientSecret", "scopes" : "user:email,read:org", "auth_url" : "https://github.com/login/oauth/authorize", "token_url" : "https://github.com/login/oauth/access_token", "api_url" : "https://api.github.com/user", "team_ids" : "", "allowed_organizations" : "" }}}Installing Grafana
We will set up Grafana in its own namespace, similar to Prometheus. This allows for easier maintenance of the application and its related components. Please note that you can either replace the Prometheus endpoint in this command while creating the datasource or you can add it later in the admin console. Also note that you need to pass a base64 encoded password for the default admin user account.
bash-3.2$ kubectl create namespace grafana
bash-3.2$ helm install stable/grafana \
     --generate-name \
     --namespace grafana \
     --set persistence.storageClassName="gp2" \
     --set adminPassword='Password' \
     --set datasources."datasources\.yaml".apiVersion=1 \
     --set datasources."datasources\.yaml".datasources[0].name=Prometheus \
     --set datasources."datasources\.yaml".datasources[0].type=prometheus \
     --set datasources."datasources\.yaml".datasources[0].url=http://prometheus-1234567890-server.prometheus.svc.cluster.local \
     --set datasources."datasources\.yaml".datasources[0].access=proxy \
     --set datasources."datasources\.yaml".datasources[0].isDefault=true \
     --set service.type=LoadBalancer \
     --set persistence.enabled=true \
     --set persistence.accessModes={ReadWriteOnce} \
     --set persistence.size=8Gi \
     -f grafana-smtp.json \
     -f grafana-github.json \
     -f grafana-server.json
Once the command has succeeded, you will see output similar to the following. Store this output for future reference:
NAME: grafana-1234567890
LAST DEPLOYED: Wed Nov 20 18:07:38 2019
NAMESPACE: grafana
STATUS: deployed
REVISION: 1
1. Get your “admin” user password by running:
kubectl get secret --namespace grafana grafana-1234567890 -o jsonpath="{.data.admin-password}" | base64 --decode ; echo2. The Grafana server can be accessed via port 80 on the following DNS name from within your cluster:
grafana-1234567890.grafana.svc.cluster.localGet the Grafana URL to visit by running these commands in the same shell:
NOTE: It may take a few minutes for the LoadBalancer IP to be available.
You can watch the status of by running
 'kubectl get svc --namespace grafana -w grafana-1234567890'

export SERVICE_IP=$(kubectl get svc --namespace grafana grafana-1234567890 -o jsonpath='{.status.loadBalancer.ingress[0].ip}')
     http://$SERVICE_IP:80
Accessing Grafana
Once the Grafana application setup is complete, run the following command to get the URL of the application.
bash-3.2$ kubectl get svc -o wide -n grafana
Copy the resulting output and launch the URL in a browser. Login to the application.
Importing dashboards
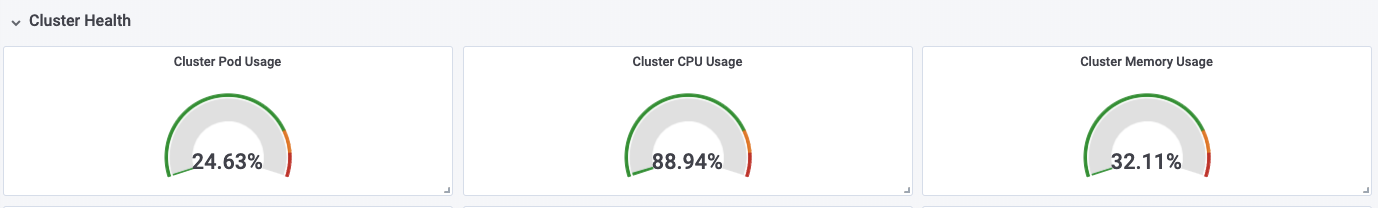
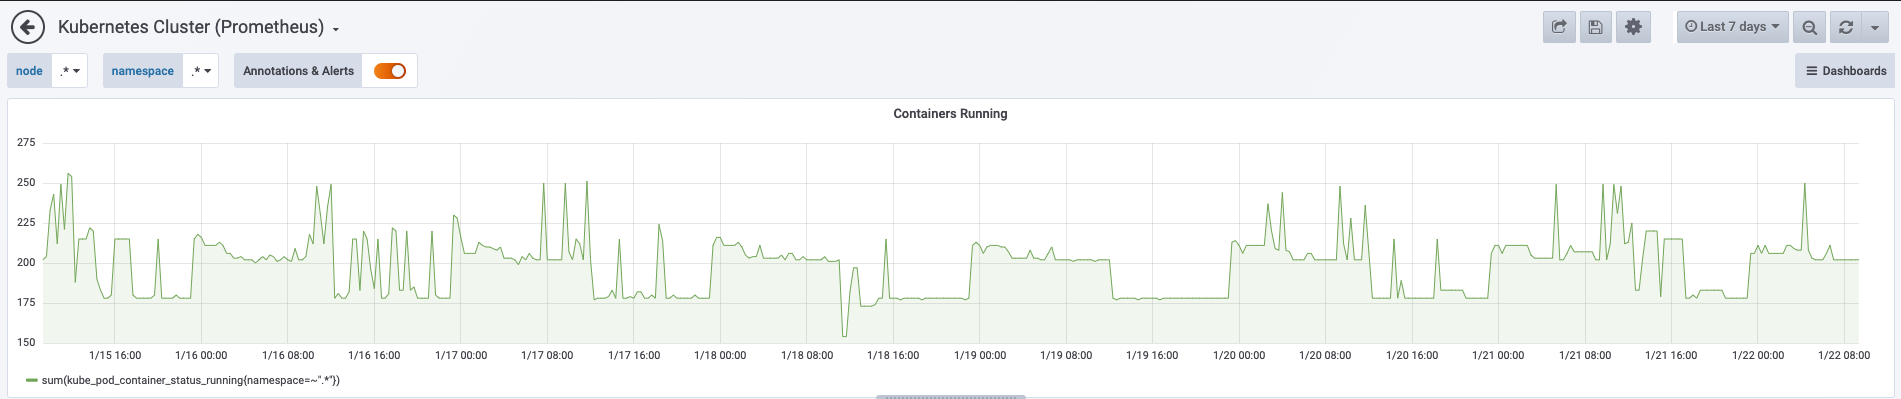
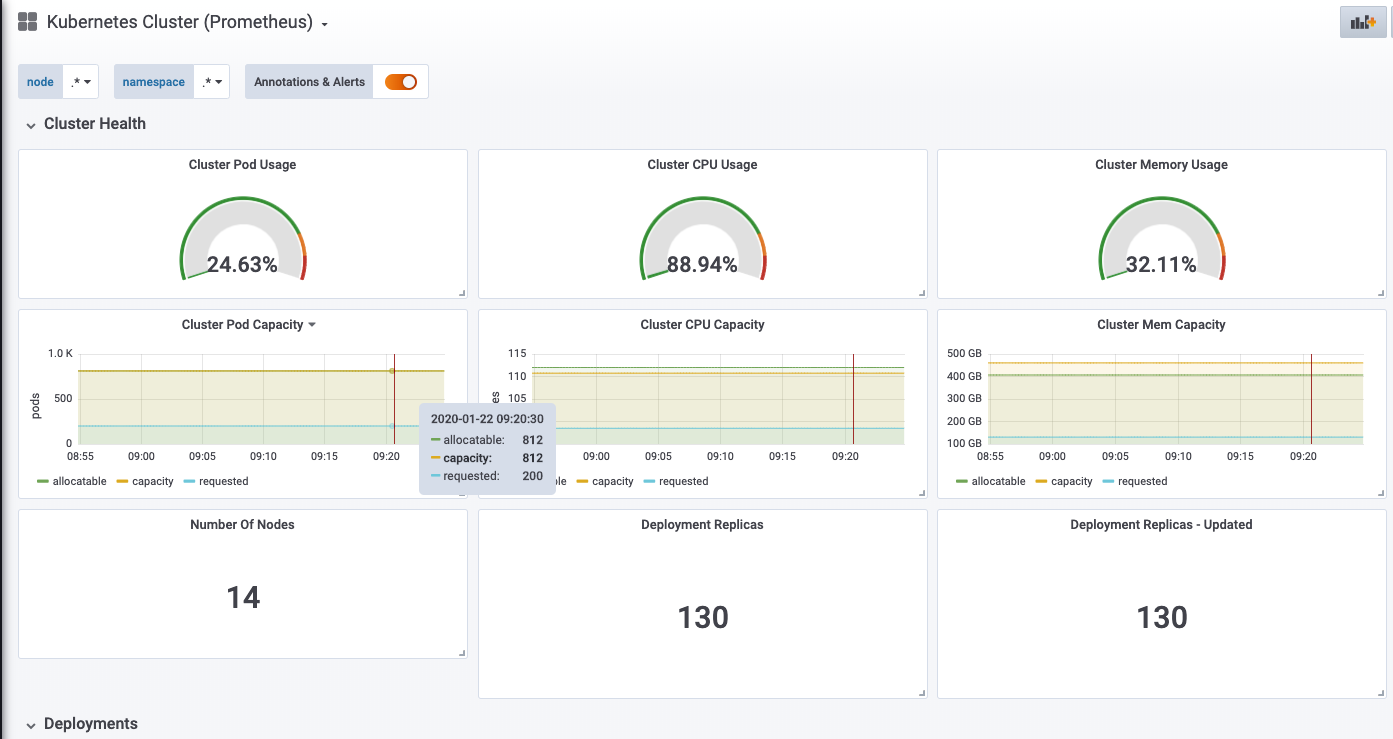
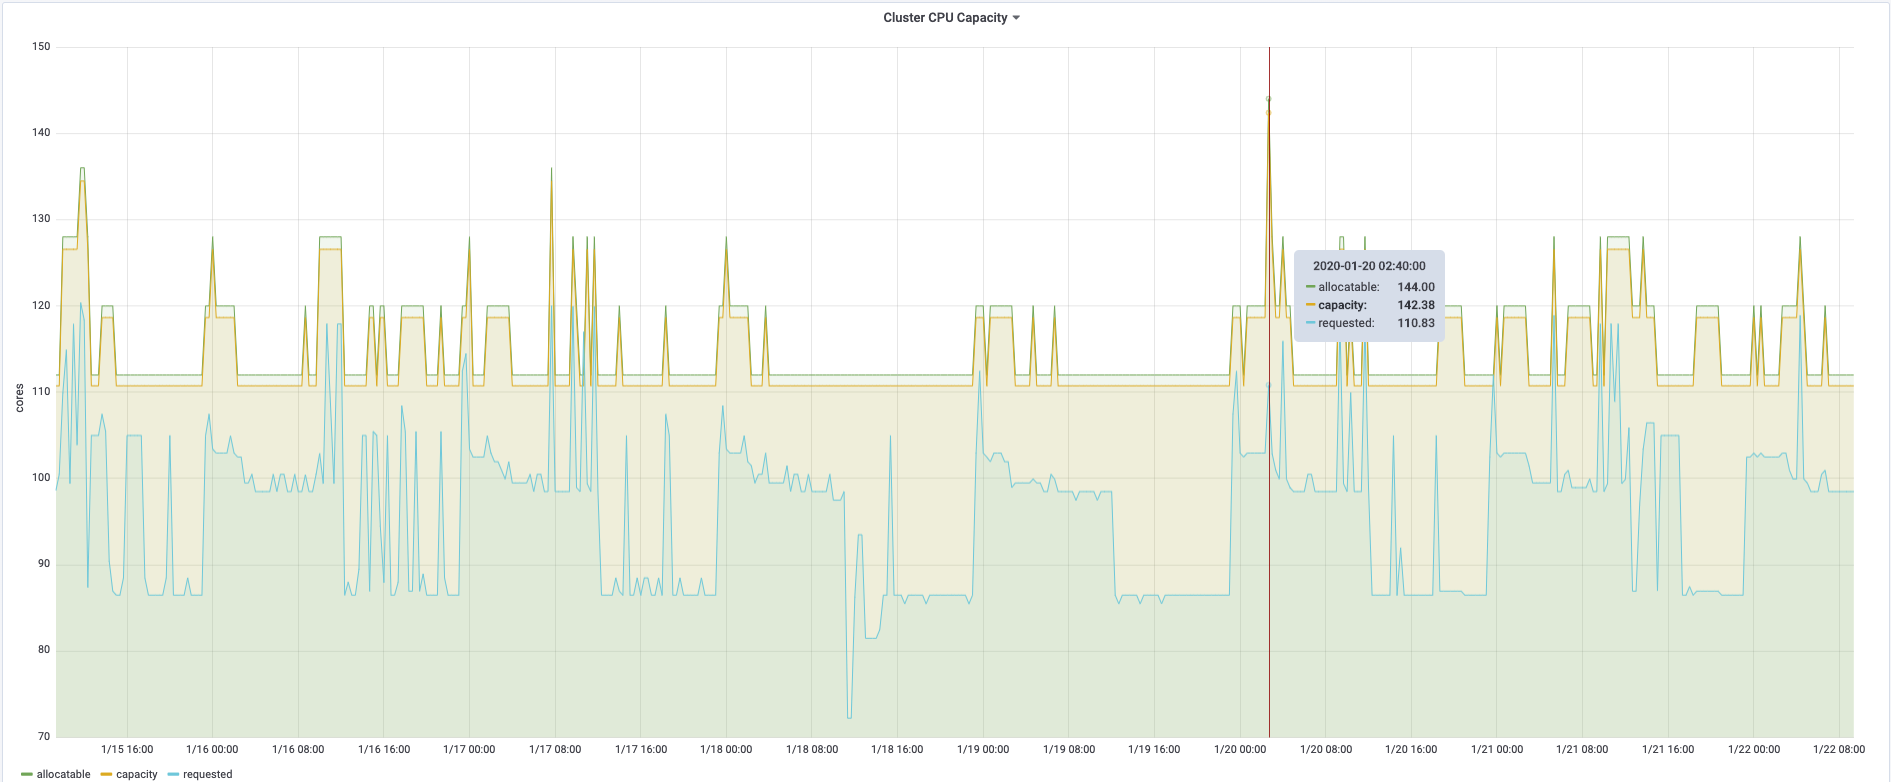
The Grafana community has created multiple dashboards that can be used to visualize data. To import a dashboard that provides a graphical representation of Prometheus data with the most commonly used statistics, we recommend importing the following dashboard.
1. Login to your Grafana application.
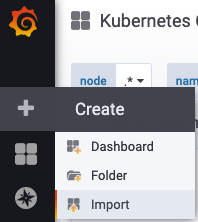
2. Mouse-over the + sign and select Import.
3. Paste the following id in the “Grafana.com Dashboard” text box: 6417 (Another dashboard that is recommended has the ID: 3662)
4. Select the “Default” datasource.
5. Wait for the import to complete.
Please note that it might take some time for the data to appear on the dashboard.
Summary: The Definitive Guide to Setting Up Prometheus with Grafana Integration for EKS
Prometheus and Grafana are incredibly powerful tools that are available for free and have a huge developer community supporting them. These tools, when used together, can help visualize Kubernetes cluster information in a user-friendly way.
If you have questions on how you can best leverage Kubernetes or need help with your Kubernetes implementation, please engage with us via comments on this blog post or reach out to us here.
Additional Reading
You can also continue to explore Kubernetes by checking out Kubernetes, OpenShift, and the Cloud Native Enterprise blog post, or Demystifying Docker and Kubernetes. You can reach out to us to plan for your Kubernetes implementation or AWS related posts such as DNS Forwarding in Route 53.