
SUMMARY:
Performance testers can effectively resolve frequently encountered HTTPS SSL socket errors in Apache JMeter by implementing specific configuration adjustments, setting proper connection timeouts, and managing SSL certificates and networking configurations.
- It is highly recommended that users utilize the most recent version of JMeter and consider enabling DEBUG mode to facilitate the diagnosis of socket connection issues.
- Users must set an adequate Connection timeout, such as 60000 milliseconds, either within the ‘HTTP Request Default’ element or on individual samplers to override the default 20-second limit.
- To test applications with internally-signed or self-signed certificates, modify
system.propertiesto configure the truststore and set properties for client certificate authentication using a keystore. - Tweak the JMeter SSL configuration by setting properties like
https.sessioncontext.shared=trueto enable session sharing and enabling stale connection checks inuser.propertiesto avoid issues with HTTP connection pooling.
Load testing efforts require checking web server configurations to ensure HTTP Keep-Alive is enabled and validating that load balancers have adequate connection limits and proper load dispersal algorithms.
Table of contents
- SUMMARY:
- Recommendation #1: Use latest version of JMeter
- Recommendation #2: Enable DEBUG mode in JMeter
- Recommendation #3: Set Connection timeout
- Recommendation #4: Delay Thread Creation
- Recommendation #5: Disable Parallel Downloads
- Recommendation #6: Configure trusted and client SSL certs
- Recommendation #7: Tweak JMeter SSL configuration
- Recommendation #8: Enable stale connection check
- Recommendation #9: Enable HTTP Keep-Alive on web servers
- Recommendation #10: Check the load balancer configuration
When executing performance and/or load testing against an SSL-enabled application using Apache JMeter, SSL socket errors can be a frequently encountered nuisance which can severely hinder your testing efforts. This article highlights how to overcome these connection-related errors by configuring and tuning JMeter accordingly.
Examples of error messages that indicate SSL socket issues in Jmeter include the following:
Non HTTP response code: java.net.SocketException Non HTTP response message: Connection resetNon HTTP response code: java.net.SocketTimeoutException Non HTTP response message: connect timed outNon HTTP response code: java.net.SocketTimeoutException Non HTTP response message: Read timed out
Recommendation #1: Use latest version of JMeter
It is highly recommended to use the most recent version, to leverage new improvements and components.
Avoid using versions that are older than 3 versions before the last one.
Recommendation #2: Enable DEBUG mode in JMeter
Add the following like to jmeter.properties to enable the JMeter Logger Panel:
jmeter.loggerpanel.display=true
To increase the log level to DEBUG via the JMeter menu:
Options -> Log Level -> DEBUG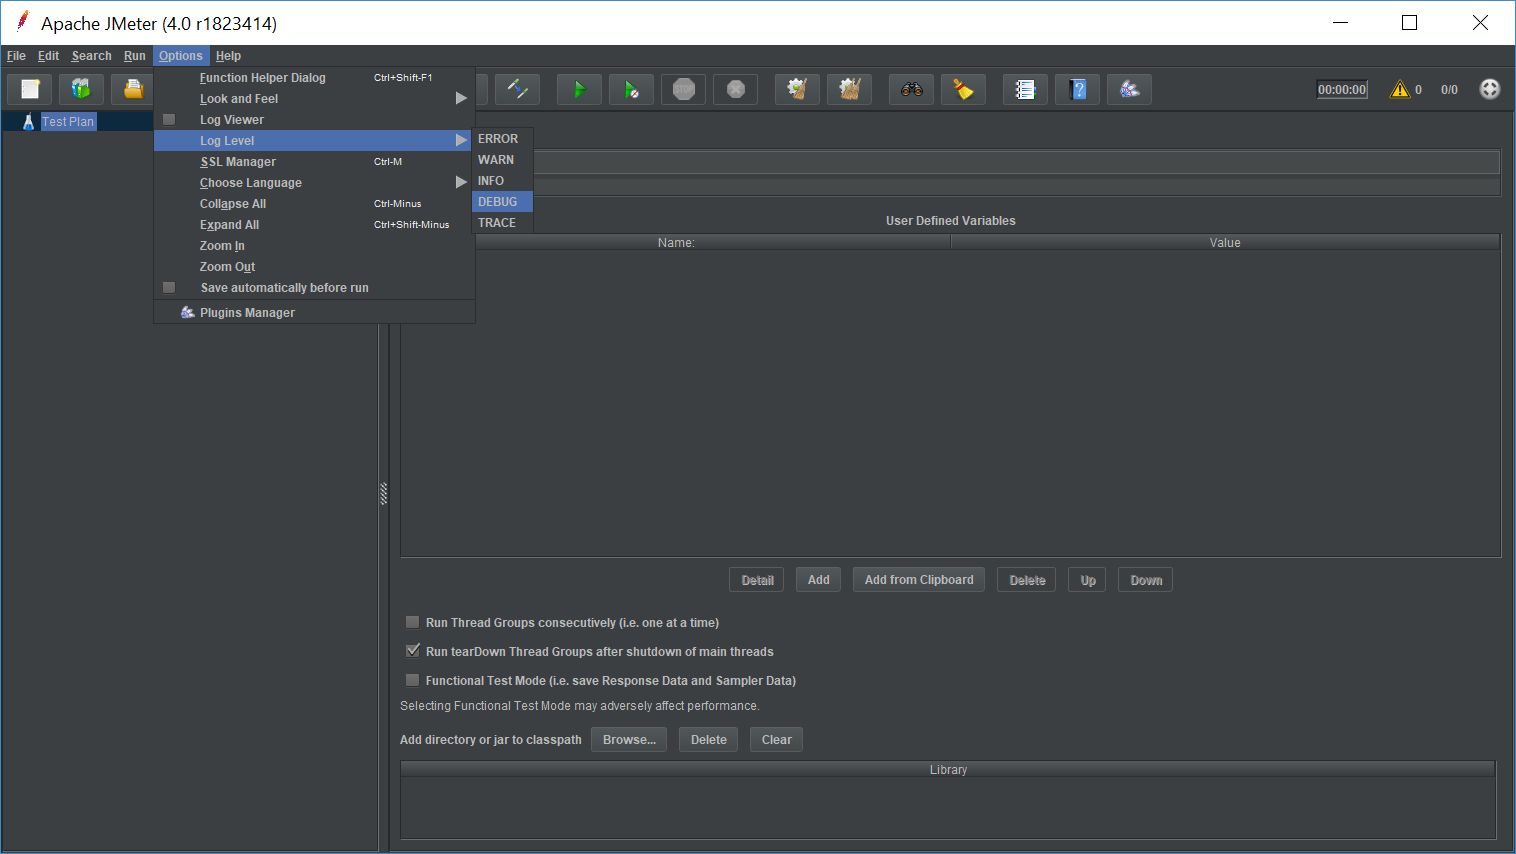
To enable debug mode for context and wire logging via log4j2.xml:
<Logger name="org.apache.http" level="debug" />Recommendation #3: Set Connection timeout
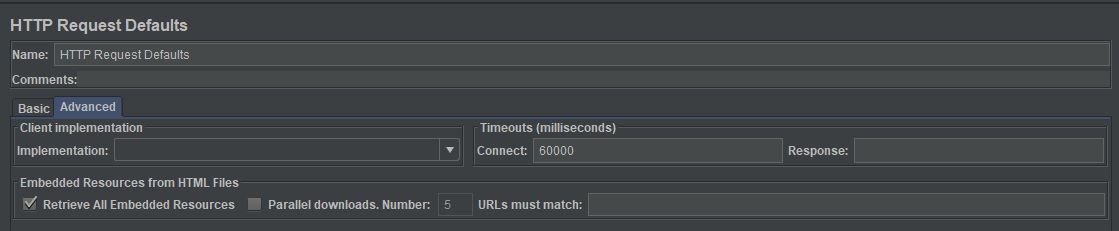
The default connection timeout in JMeter is 20 seconds out-of-the-box. To help diagnose and resolve socket connection issues, it is often helpful to increase this value. To do so, specify a higher connection timeout the HTTP Request object in your JMeter test plan. For example, set to 60000 (milliseconds) to increase the overall timeout to 60 seconds.
Add a ‘HTTP Request Default’ configuration element from the ‘Configuration Elements’ option (i.e., Right-click test plan and add this ‘HTTP Request Default’).
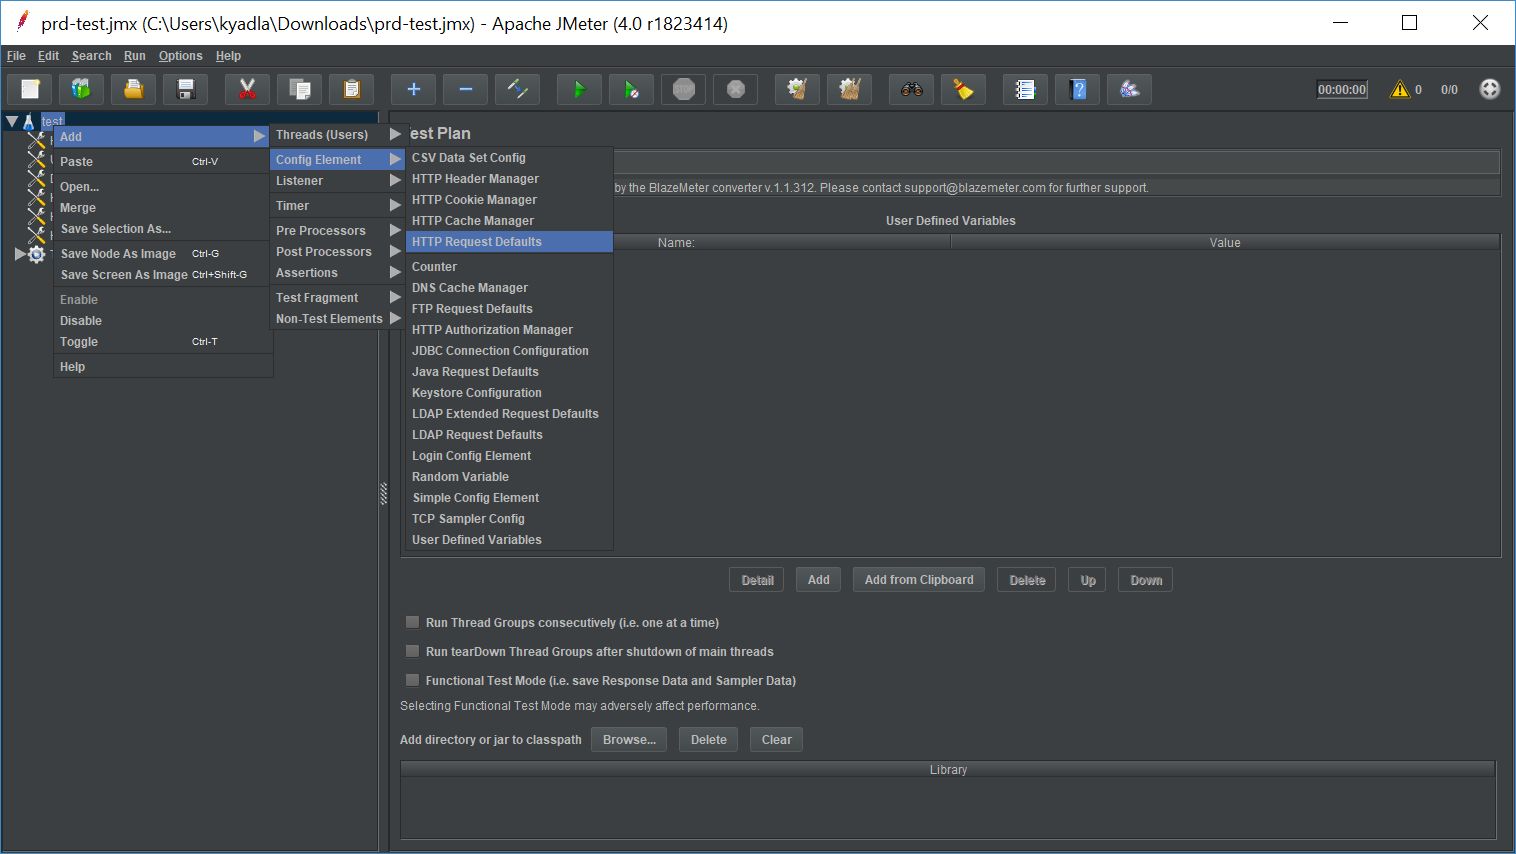
In this ‘HTTP Request Default’, there is an option – Connect in ‘Timeouts (milliseconds)’ Specify your connection timeout value in this field and it will be applied to all child samplers. If this ‘HTTP Request Default’ is added at Test Plan level, then it will be applied to all samplers and all thread groups.
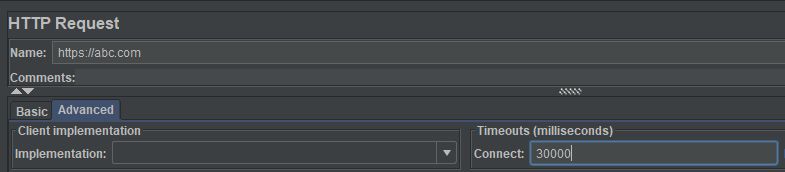
In order to specify individual Connection Timeout, then specify in same field of each sampler. Individual sampler Connection timeout will override the ‘HTTP Request Default’ connection timeout value.
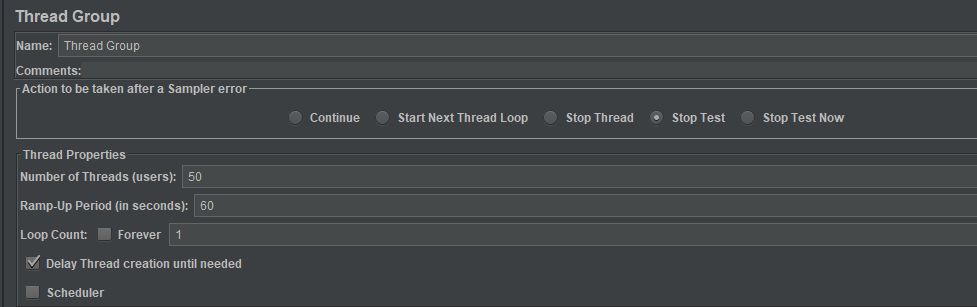
Recommendation #4: Delay Thread Creation
JMeter has an option to delay thread creation until the thread starts sampling (i.e., after any thread group delay and the ramp-up time for the thread itself). This allows for a very large total number of threads, provided that not too many are active concurrently.
Recommendation #5: Disable Parallel Downloads
JMeter uses more resources to simulate the browser parallel fetching of embedded resources like css, gif, js and static content. If there are many users, too many threads may get created and start affecting the response times adversely due to bandwidth contention at the JMeter side. If many users are to be simulated, it’s recommended to disable parallel downloads as JMeter does not simulate browser’s cache and browsers don’t re-download embedded resources on subsequent requests.

Recommendation #6: Configure trusted and client SSL certs
If you have internally-signed or self-signed certificates on your application server tier, JMeter will need to be configured to recognize those certificates as valid. To remedy this, modify system.properties and configure the truststore with the relevant signer certs.
# Truststore properties (trusted certificates)

javax.net.ssl.trustStore=C:/trust.jks

javax.net.ssl.trustStorePassword=sample
If your application requires SSL client certificate authentication or authorization, you will need to create a keystore and set the following properties in the system.properties file pointing to that keystore:
# Keystore properties (client certificates)

javax.net.ssl.keyStore=C:/key.jks

javax.net.ssl.keyStorePassword=sample
Recommendation #7: Tweak JMeter SSL configuration
Set the properties below in the jmeter.properties to adjust the way that JMeter handles SSL sessions, protocols and ciphers:
To enable SSL session sharing:
https.sessioncontext.shared=true
To set Default HTTPS protocol level:
https.default.protocol=TLSv1.2
To enable multiple HTTPS protocols:
https.socket.protocols=TLSv1 TLSv1.2
To enable multiple ciphers:
https.cipherSuites=TLS_RSA_WITH_AES_128_CBC_SHA256 TLS_RSA_WITH_AES_256_CBC_SHA256
To retain SSL context for the duration of test:
https.use.cached.ssl.context=true
To set retry count on http 4
httpclient4.retrycount=1
Recommendation #8: Enable stale connection check
To avoid issues with HTTP connection pooling, it may be necessary to enable a stale connection check in JMeter. This step should be used when receiving “Socket Closed” exceptions during JMeter test runs. To enable the stale connection check, set the following property in user.properties:
http.connection.stalecheck$Boolean=true
Recommendation #9: Enable HTTP Keep-Alive on web servers
Keep-Alive is very important feature of HTTP protocol. It allows the client to make several HTTP requests over single TCP connection. This provides a great performance gain, since otherwise establishing many TCP connections will produce a lot of unnecessary networking overhead.
Recommendation #10: Check the load balancer configuration
If your load test is hitting an application which is fronted by a load balancer, ensure that the load balancer is configured with an adequate max connections limit to handle the anticipated load. Likewise, validate that the load balancing algorithm is not skewing excessive traffic to one or more application server instances, and that load is adequately dispersed amongst application server backends.