 Microsoft Excel is the de facto standard spreadsheet tool used by businesses around the world and houses some of the most critical business information. However businesses often struggle to make this information available to employees and other stakeholders that would benefit from having access to this information.
An enterprise portal such as Liferay is a framework for integrating information, people and processes across organizational boundaries. It provides a secure unified access point in the form of a web-based user interface, and is designed to aggregate and personalize information through application-specific portlets. If we can take some of the business information housed in Excel documents, and surface that information graphically via portlets on the enterprise portal, then enterprises would be able to derive much greater value.
Many years back, Plumtree Portal was a leading portal product in the early 2000s until its acquisition by BEA Systems in 2005, and Oracle subsequently acquired BEA. Plumtree’s former portal product became part of BEA AquaLogic Use Interaction Portal suite which has now been replaced by another Oracle product. One of Plumtree’s innovations was providing the Plumtree Gadget Framework for Microsoft Excel, which empowered portal users to embed Microsoft Excel tables and charts in a personalized or community portal page. The Excel Gadget Framework helped reduce development costs by allowing customers to publish a vast range of new resources in the portal from every business unit and workgroup in the organization without any coding, including the data imported from applications such as Oracle, SAP and Siebel, as well as the objectives and performance metrics stored in spreadsheets on manager’s computers.
In conversations with customers looking to migrate from Plumtree to Liferay, we found that many of these customers found the Plumtree Excel portlets a killer feature. So, we at XTIVIA, decided to build the XTIVIA Excel Chart Viewer portlet to address this need – you can upload relevant Excel documents to the Liferay document library using Liferay out-of-the-box functionality, and then use the XTIVIA portlet to point to the Excel document in the Liferay document library, and configure the portlet to display a chart using the data in the specified Excel worksheet cell range. You can add multiple instances of this portlet to the Portal with each instance configured to point to different Excel files, different worksheets, and different cell ranges.
In this blog, I’m going to provide some usage information about the XTIVIA Excel Chart Viewer portlet that was developed using Apache POI and some charting APIs. In the portlet, users can easily configure the data source using excel files uploaded in the Liferay document library, the data range inside the excel file and the chart type to be rendered.
The following steps describe how to add an Excel Chart Viewer portlet on a page and configure it:
1. Upload the Excel file that you want to generate charts from to the Liferay document library.

2. Add “Excel Chart” portlet on a page.
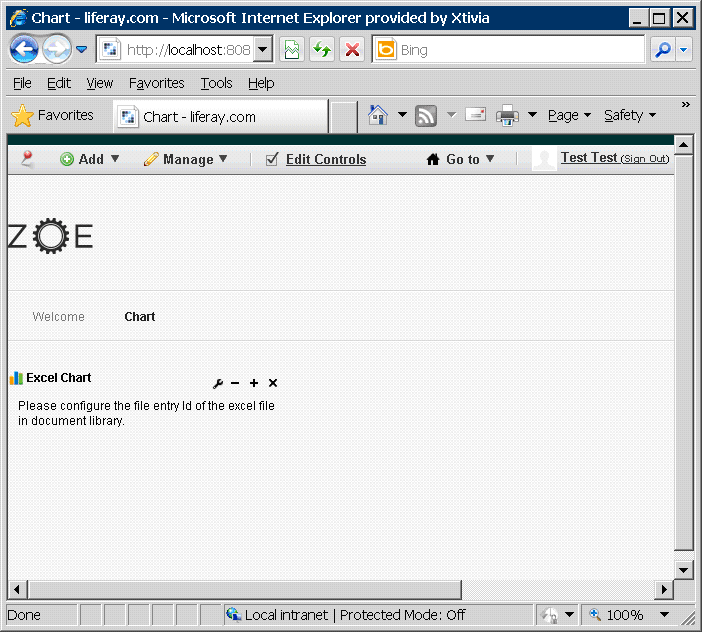
3. Choose to configure the portlet.
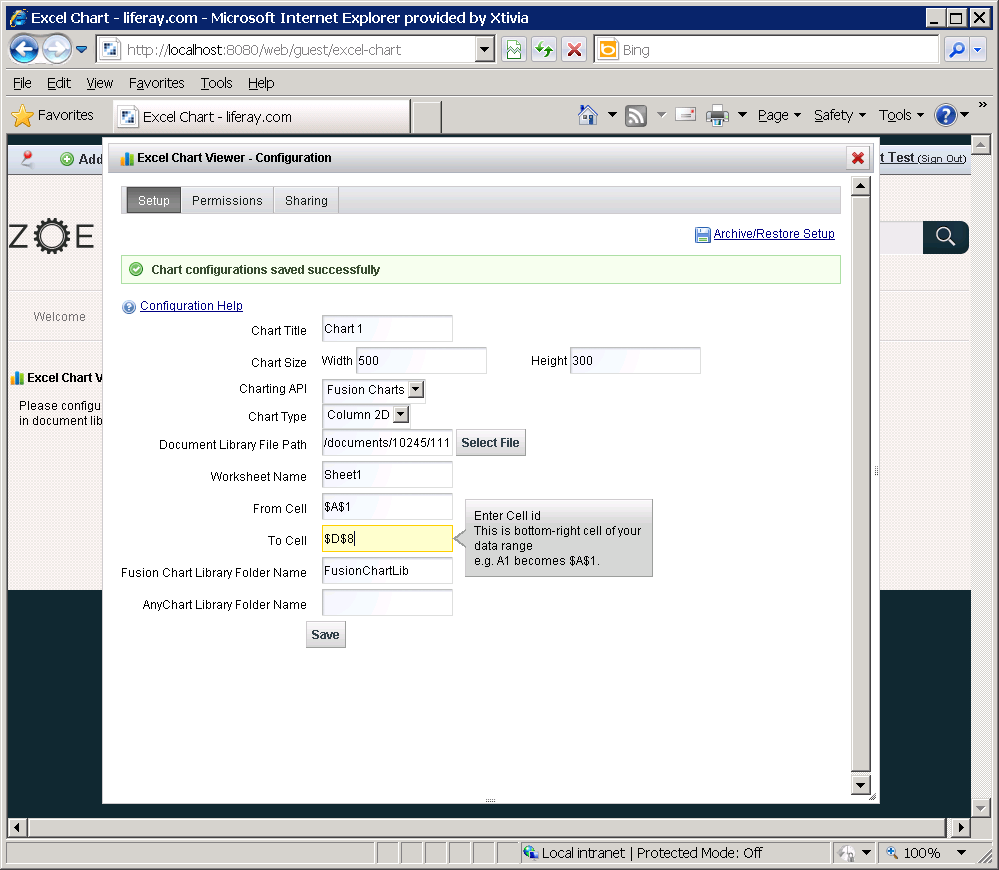
- Charting API: Currently we support Google Charts out of the box. FusionChart library and AnyChart library can be added following the instructions below in step 6.
- Chart Type: For each chart library, we have 2 different chart types available which are Column 2D, Column 3D.
- Worksheet Name, From Cell, To Cell: To specify the cell range of the data in the excel file. The available values of “From Cell” and “To Cell” are the cell id in the spreadsheet. For example, we can specify “$A$1” as the “From Cell” and “$D$8” as the “To Cell”.

4. Select the Excel file from the document library.

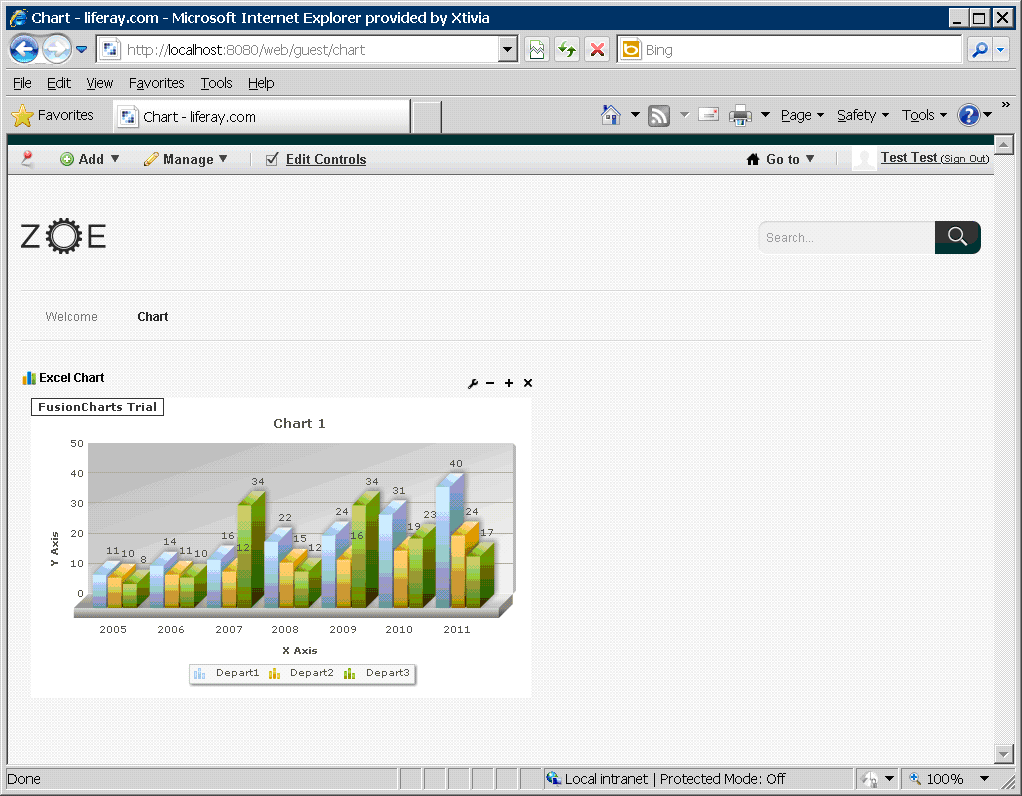
5. Save the settings and close the dialog box. The chart shows in the portlet.
6. The Excel Chart Portlet provides support for Google Charts out of the box. The portlet also has capabilities to support additional charting APIs such as FusionChart and AnyChart, but they require additional configuration as we cannot redistribute these libraries with the Excel Chart Portlet.
To add FusionChart support, follow the instructions below:
a. Copy the plugin war file to a new empty folder called “war_tmp”. and run “jar xvf excel-chart-portlet-$VERSION_NUMBER.war” to unpack the war file.
b. Create a new folder called “FusionChartLib” in the current folder “war_tmp”.
c. Copy “js” folder and “swf” folder from the FusionChart library release into the folder “FusionChartLib”.
d. Run “jar cvf excel-chart-portlet-$VERSION_NUMBER.war .” to package the updated war file and then deploy it to Liferay server.
e. Open the portlet configuration screen and specify the chart library folder’s relative path (“FusionChartLib”) in the FusionChart Library Folder Name field and save it.
f. Once the validation is successful, FusionChart will be available in the chart API drop-down list.
To add AnyChart support, follow the instructions below:
a. Copy the plugin war file to a new empty folder called “war_tmp”. and run “jar xvf excel-chart-portlet-$VERSION_NUMBER.war” to unpack the war file.
b. Create a new folder called “AnyChartLib” in the current folder “war_tmp”.
c. Copy “js” folder and “swf” folder from the AnyChart library release into the folder “AnyChartLib”.
d. Run “jar cvf excel-chart-portlet-$VERSION_NUMBER.war .” to package the updated war file and then deploy it to Liferay server.
e. Open the portlet configuration screen and specify the chart library folder’s relative path (“AnyChartLib”) in the AnyChart Library Folder Name field and save it.
f. Once the validation is successful, FusionChart will be available in the chart API drop-down list.

Please note that this portlet will soon be available for download from the Liferay Marketplace free of charge.
We plan to offer other innovations in terms of surfacing Excel data via portlets including more charting options, more charting libraries, data grids, and more. Please do comment on this blog post with features that you would like to see added.
For more information about expert help with your Liferay implementation, check out https://www.xtivia.com/portal/liferay-portal, or contact us at
Microsoft Excel is the de facto standard spreadsheet tool used by businesses around the world and houses some of the most critical business information. However businesses often struggle to make this information available to employees and other stakeholders that would benefit from having access to this information.
An enterprise portal such as Liferay is a framework for integrating information, people and processes across organizational boundaries. It provides a secure unified access point in the form of a web-based user interface, and is designed to aggregate and personalize information through application-specific portlets. If we can take some of the business information housed in Excel documents, and surface that information graphically via portlets on the enterprise portal, then enterprises would be able to derive much greater value.
Many years back, Plumtree Portal was a leading portal product in the early 2000s until its acquisition by BEA Systems in 2005, and Oracle subsequently acquired BEA. Plumtree’s former portal product became part of BEA AquaLogic Use Interaction Portal suite which has now been replaced by another Oracle product. One of Plumtree’s innovations was providing the Plumtree Gadget Framework for Microsoft Excel, which empowered portal users to embed Microsoft Excel tables and charts in a personalized or community portal page. The Excel Gadget Framework helped reduce development costs by allowing customers to publish a vast range of new resources in the portal from every business unit and workgroup in the organization without any coding, including the data imported from applications such as Oracle, SAP and Siebel, as well as the objectives and performance metrics stored in spreadsheets on manager’s computers.
In conversations with customers looking to migrate from Plumtree to Liferay, we found that many of these customers found the Plumtree Excel portlets a killer feature. So, we at XTIVIA, decided to build the XTIVIA Excel Chart Viewer portlet to address this need – you can upload relevant Excel documents to the Liferay document library using Liferay out-of-the-box functionality, and then use the XTIVIA portlet to point to the Excel document in the Liferay document library, and configure the portlet to display a chart using the data in the specified Excel worksheet cell range. You can add multiple instances of this portlet to the Portal with each instance configured to point to different Excel files, different worksheets, and different cell ranges.
In this blog, I’m going to provide some usage information about the XTIVIA Excel Chart Viewer portlet that was developed using Apache POI and some charting APIs. In the portlet, users can easily configure the data source using excel files uploaded in the Liferay document library, the data range inside the excel file and the chart type to be rendered.
The following steps describe how to add an Excel Chart Viewer portlet on a page and configure it:
1. Upload the Excel file that you want to generate charts from to the Liferay document library.
2. Add “Excel Chart” portlet on a page.
3. Choose to configure the portlet.
- Charting API: Currently we support Google Charts out of the box. FusionChart library and AnyChart library can be added following the instructions below in step 6.
- Chart Type: For each chart library, we have 2 different chart types available which are Column 2D, Column 3D.
- Worksheet Name, From Cell, To Cell: To specify the cell range of the data in the excel file. The available values of “From Cell” and “To Cell” are the cell id in the spreadsheet. For example, we can specify “$A$1” as the “From Cell” and “$D$8” as the “To Cell”.
4. Select the Excel file from the document library.
5. Save the settings and close the dialog box. The chart shows in the portlet.
6. The Excel Chart Portlet provides support for Google Charts out of the box. The portlet also has capabilities to support additional charting APIs such as FusionChart and AnyChart, but they require additional configuration as we cannot redistribute these libraries with the Excel Chart Portlet.
To add FusionChart support, follow the instructions below:
a. Copy the plugin war file to a new empty folder called “war_tmp”. and run “jar xvf excel-chart-portlet-$VERSION_NUMBER.war” to unpack the war file.
b. Create a new folder called “FusionChartLib” in the current folder “war_tmp”.
c. Copy “js” folder and “swf” folder from the FusionChart library release into the folder “FusionChartLib”.
d. Run “jar cvf excel-chart-portlet-$VERSION_NUMBER.war .” to package the updated war file and then deploy it to Liferay server.
e. Open the portlet configuration screen and specify the chart library folder’s relative path (“FusionChartLib”) in the FusionChart Library Folder Name field and save it.
f. Once the validation is successful, FusionChart will be available in the chart API drop-down list.
To add AnyChart support, follow the instructions below:
a. Copy the plugin war file to a new empty folder called “war_tmp”. and run “jar xvf excel-chart-portlet-$VERSION_NUMBER.war” to unpack the war file.
b. Create a new folder called “AnyChartLib” in the current folder “war_tmp”.
c. Copy “js” folder and “swf” folder from the AnyChart library release into the folder “AnyChartLib”.
d. Run “jar cvf excel-chart-portlet-$VERSION_NUMBER.war .” to package the updated war file and then deploy it to Liferay server.
e. Open the portlet configuration screen and specify the chart library folder’s relative path (“AnyChartLib”) in the AnyChart Library Folder Name field and save it.
f. Once the validation is successful, FusionChart will be available in the chart API drop-down list.
Please note that this portlet will soon be available for download from the Liferay Marketplace free of charge.
We plan to offer other innovations in terms of surfacing Excel data via portlets including more charting options, more charting libraries, data grids, and more. Please do comment on this blog post with features that you would like to see added.
For more information about expert help with your Liferay implementation, check out https://www.xtivia.com/portal/liferay-portal, or contact us at https://www.xtivia.com/contact.
Visit the Liferay Marketplace to download.
Visit the Liferay Marketplace to download.