
Time Series Introduction
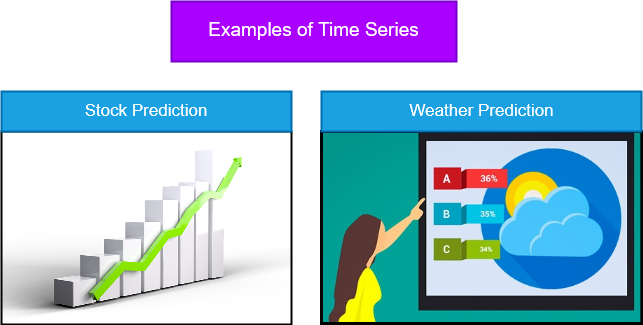
Time series forecasting is predicting an attribute value using time such as the stock price or daily temperature. A typical use case of time series is predicting seasonal data. Time series is a relatively new field in data science. Popular time series libraries are Prophet from Facebook and Orbit from Uber.
There has been a notable increase in time series problems on data science competition platforms within the past three years. Time series forecasting problems are solved with a variety of methods. Simple methods include moving averages or complex techniques like ARIMA and boosting. In this blog, we will discuss the application of the ARIMA technique for solving the JetRail time series competition.
JetRail Competition Overview
The competition is a fictional scenario regarding an investment decision. The investing company, Unicorn Investors, wants to invest in a tech firm named JetRail that specializes in railway technologies and has recently created a new propulsion technology for faster trains. According to finance experts, an investment in JetRail is feasible only if a minimum of one million passengers travel by train in the next eighteen months.
It is common practice to hire domain experts and data scientists for critical business decisions. In this fictional scenario, the investment company hired data scientists to forecast the passenger traffic. The objective of the data scientist is to predict the number of passengers that travel per hour for the next seven months.
The contest is evaluated based on Root Mean Square Error (RMSE).
ARIMA Model
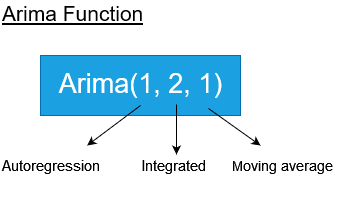
ARIMA (autoregressive integrated moving average) is a popular technique for time series forecasting used when the current observation is dependent on the previous observations (historical data). The previous observations are known as lag observations.
The ARIMA model uses three components for forecasting data. They are:
- Autoregression (AR): The relationship between an observation and lagged observations.
- Integrated (I): The difference between each observation and its predecessor required for making the time series stationary.
- Moving Average (MA): The difference between an observation and moving average based on lagged observations.
The ARIMA function tries to fit the data using these three components.
Usually, we apply different ARIMA components on the same time series and select the best model. Another approach is to use the auto-ARIMA function. Auto-ARIMA fits the data with various ARIMA components and suggests the best model.
Favor simpler models with smaller component values over complex models. For example, if ARIMA(1,1,2) and ARIMA(2,1,4) are giving the same accuracy, choose the simpler ARIMA(1,1,2) as the final model.
JetRail Notebook
The python notebook I created for solving the JetRail problem is available for download at GitLab.
Import Data and Create Time Series Object
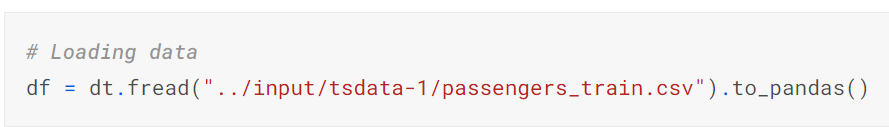
Import the data with the fread function of the Pandas library.
Exploratory Data Analysis
Inspect the first five rows with the head function.
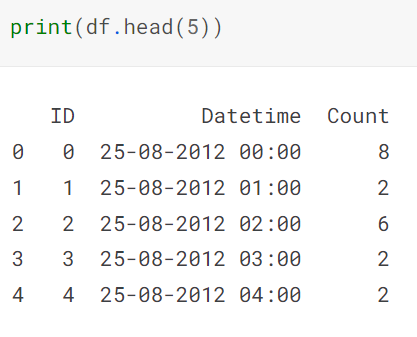
The data is a simple time series with the passenger count per hour. We need to forecast the count variable.
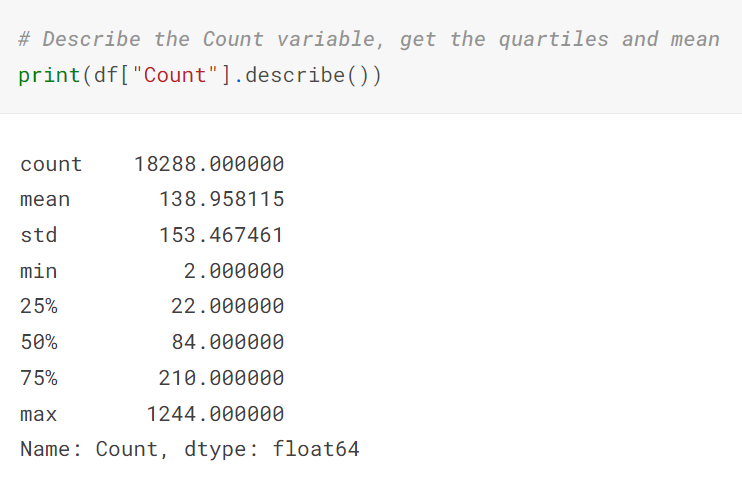
The describe function on the count variable gets its statistical data.
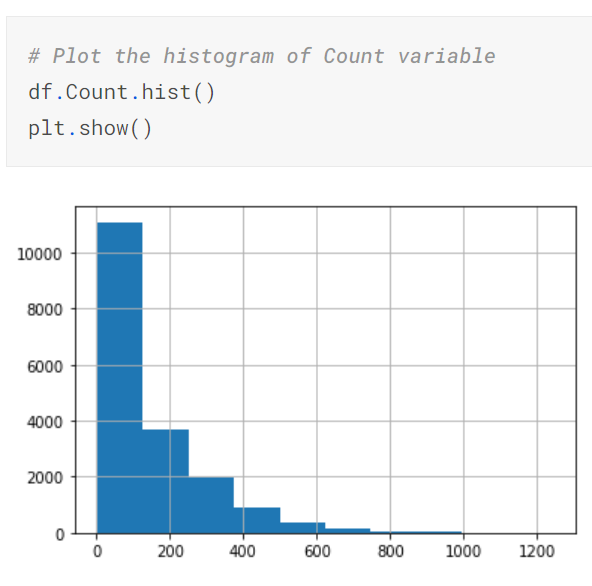
Given below is the histogram of the count variable.
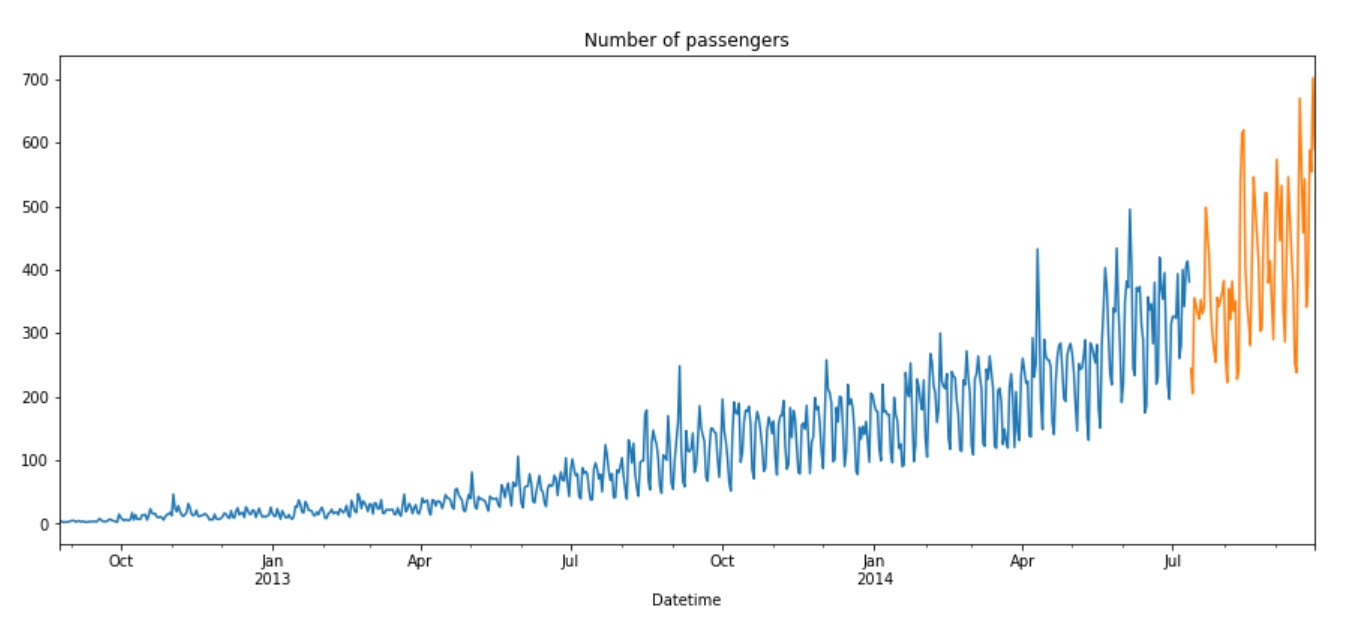
Plot the monthly data to understand the data trend.

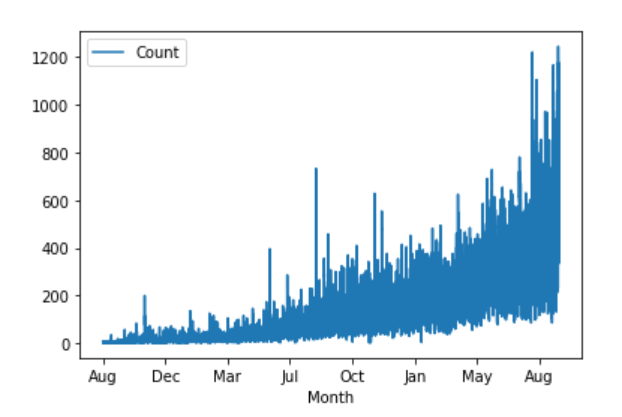
The plot shows an exponential increase in the passenger traffic.
Split Data
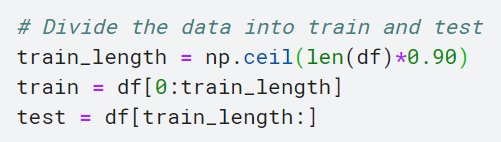
It is typical to divide the data into train and test data. The machine learning models perform well on the data that is used for training. So, it is imperative to test the model on new data. We divide the data into two parts (90% of training and 10% for testing the model).
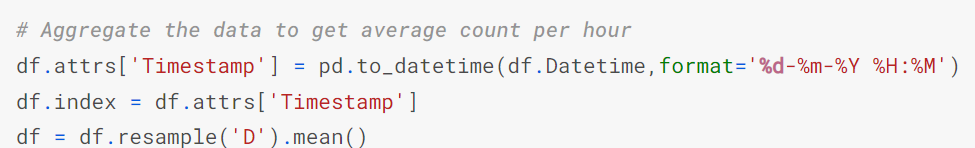
Feature Engineering
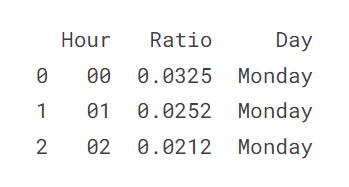
Get the average number of passengers that travel per hour.
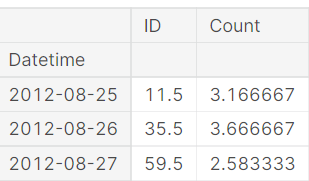
Given below is the plot of average hourly data.
Forecasting Model
We created a forecasting model with the SARIMA function. SARIMA is a variant of ARIMA that has an additional seasonal component. The number of passengers depends on the day of the week. SARIMA is a good choice because the data is seasonal.
We used the seasonal component of 7, indicating that the data depends on the day of the week.
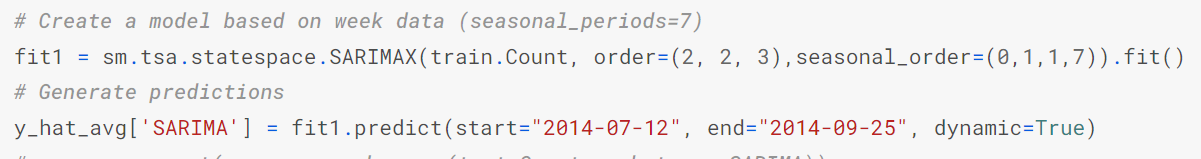
Given below is the graph of actual data and predictions.
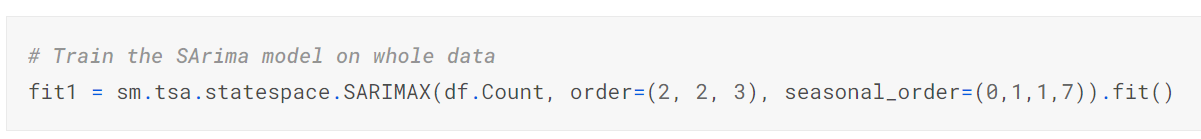
Final Model
In the previous step, we trained the model only on training data. For the final model, we retrained the model on the entire data. A model trained on more data is more accurate.
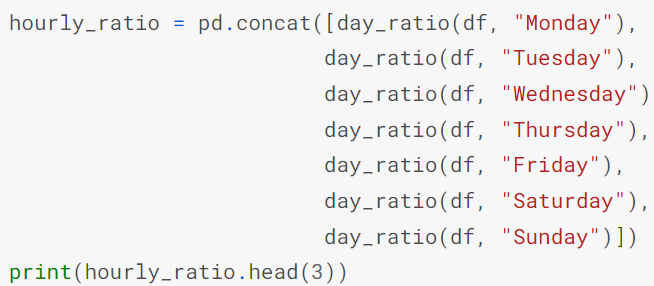
We calculated the average hourly data per day. The objective of the competition is to calculate the number of passengers per hour. To achieve this, we calculate the ratio of passengers per hour and multiply that with average hourly data.

Submission and Score
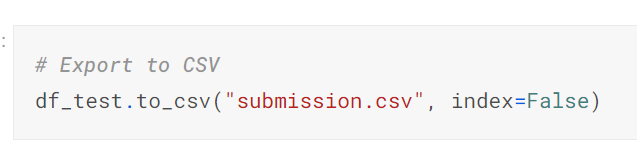
The competition accepts the test data as input in CSV format. We exported the data into CSV format using the to_csv function.
The rank of this notebook is 65 with an RMSE value of 145.
If you have any questions about forecasting, machine learning, need help with model development, or operationalization, please contact us.