SUMMARY:
Unlock monday.com’s potential. Learn how to use “digital Lego blocks”—from boards and automations to dashboards—to build a custom, high-efficiency business tool.
Table of contents
Introduction
For many, monday.com is a puzzle: is it a spreadsheet, a project manager, or a CRM? The answer is all of the above. To truly understand the platform, stop viewing it as rigid software and start seeing it as a set of digital “Lego blocks.”
monday.com is a “low-code” canvas that provides the raw materials—boards, columns, and automations—and asks: “What do you need to build today?” This guide takes you “under the hood” to explain the platform’s core mechanics and shows you how to transform a simple grid into a bespoke powerhouse of business efficiency.
The Hierarchy Organizing
To truly understand how monday.com structures data in a strict yet flexible hierarchy. Learning this structure is step one.
Workspaces are like separate offices or departments. For example, you might have a Marketing Workspace and an HR Workspace, keeping teams and data separate.
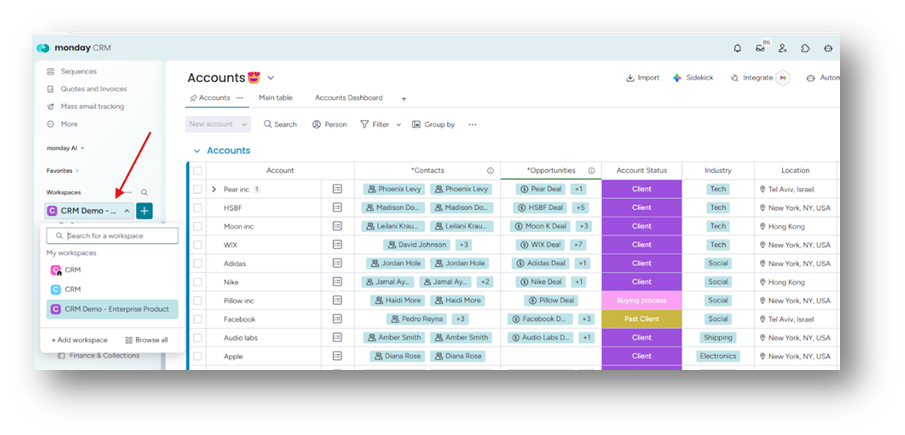
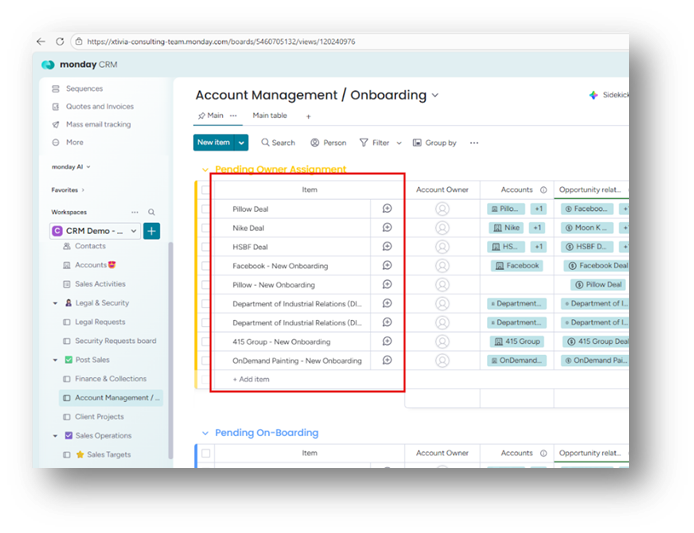
Boards are where the work happens. A Board is a visual table for tasks, clients, or feature roadmaps.
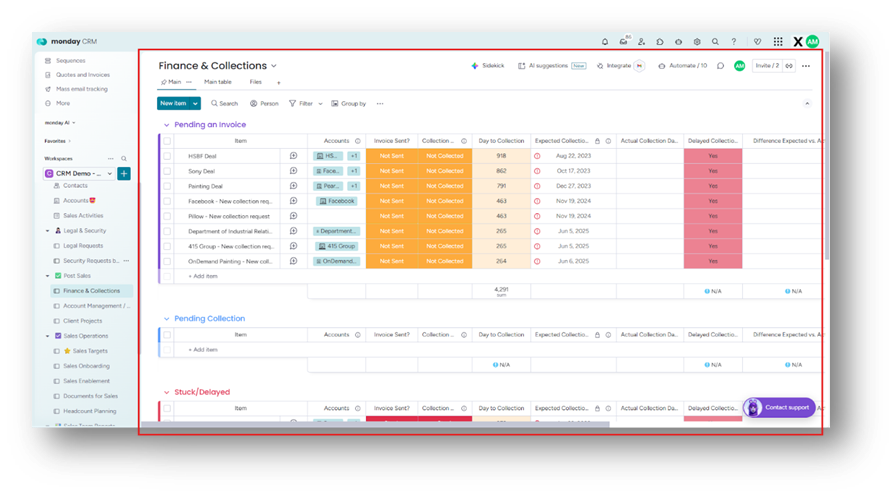
Within a board, rows are grouped into color-coded sections. Task lists use groups like “To Do,” “Doing,” and “Done.” Content calendars use months such as “January,” “February,” and “March.”
Items are individual rows. Each item represents one unit of work, such as a task, client, lead, or bug report.
If an item is too broad (for example, “Website Redesign”), break it into Subitems, which are smaller tasks that make up the larger project (for example, “Design Homepage,” “Write Copy”).
The Columns: The Data Engine
If the Board is the body, the columns are the DNA. Here, monday.com stands apart from Excel. You don’t just type text—you add functional columns.
- The People Column assigns items to designated team members, triggering notifications.
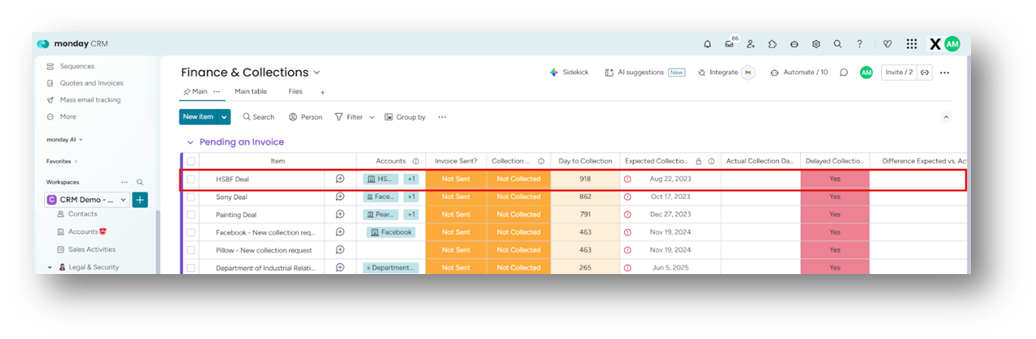
- The Status Column uses visual, color-coded labels: Stuck (red), Working on it (orange), and Done (green). These can trigger automation.
- The Date/Timeline Column visualizes deadlines for tasks and projects.
- The Numbers Column handles information such as budgets, hours, and inventory counts.
- Mirror Column: Links to data on other boards. View Client Database info while in Project Tasks to keep data consistent.
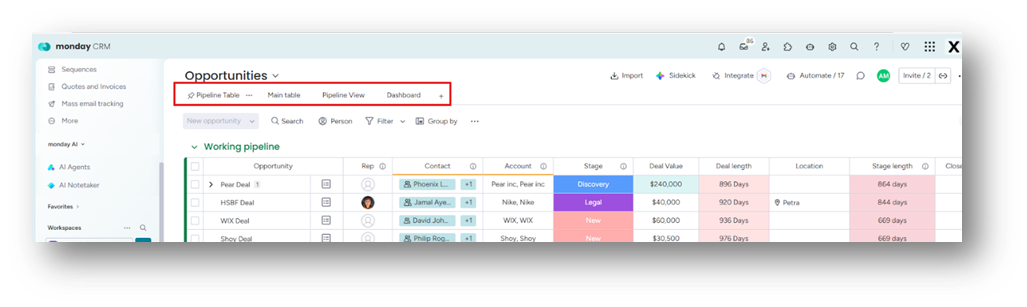
The Views: Visualizing the Data
monday.com recognizes that everyone processes data differently. Views let you display board data in various formats without changing the data itself.
- Kanban View: Turns your board into a card-based workflow (like Trello), moving cards from left to right.
- Gantt View: Transforms your dates and timelines into a chart that displays dependencies. See when tasks must follow others.
- Calendar View: Displays items on a monthly or weekly calendar grid.
- Chart View: Aggregates data into pie or bar charts, such as tasks grouped by Status.
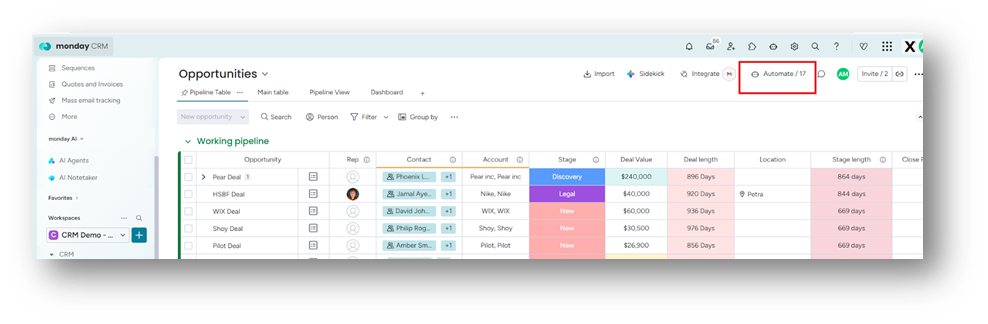
Automations: The “If This, Then That” Robot
monday.com saves time with automation rules running in the background. They use Trigger, Condition, and Action.
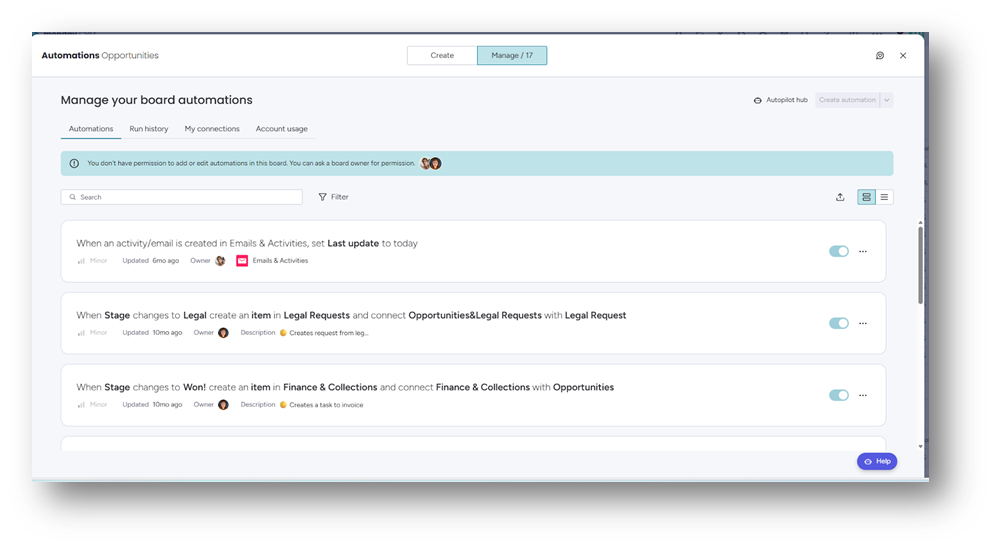
- Example 1: “When Status changes to Done (Trigger), Move Item to Archive Group (Action).”
- Example 2: “When Date arrives (Trigger) and Status is not Done (Condition), Notify Manager (Action).”
No coding is needed. Just select parameters from drop-down menus to build automations.
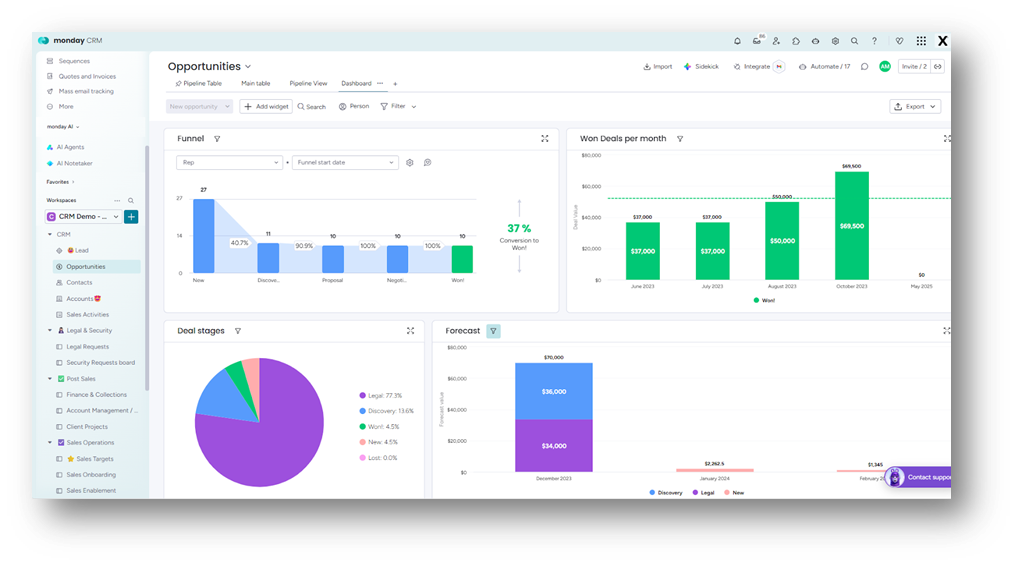
Dashboards: The 30,000-Foot View
Boards show details. Dashboards reveal trends. A Dashboard is a blank canvas filled with Widgets that pull data from multiple boards.
- The Battery Widget: Shows a consolidated progress bar of all projects across the company.
- The Workload Widget: Shows who is over capacity or available, helping manage resources effectively.
- The Numbers Widget: Sums up budgets or revenue from ten different boards into one big “Total Revenue” figure.
So, in conclusion, monday.com is essentially a digital canvas that gives you a grid and asks, “What should this be?” By combining Columns, Views, and Automations, you can build a CRM, bug tracker, or event planner in minutes. It is a “low-code” platform that hides technical complexity behind a friendly, colorful interface, making powerful tools accessible to everyone.
However, while the platform is intuitive, XTIVIA ensures you aren’t just building a board, but a powerhouse of efficiency. Our team helps you navigate the “blank canvas” by expertly installing and configuring your workspace to match your specific business DNA.
Whether it’s mapping complex workflows or integrating your existing tech stack, XTIVIA transforms that friendly interface into a bespoke, enterprise-grade solution that scales with you.
At XTIVIA, we’re more than just consultants; we’re your long-term strategic guides. From initial deployment to our flexible monday.com and CRM Admin On-Demand service, we ensure your monday.com environment works for you, not the other way around.
Learn more about our monday.com services.
Contact us for more info.