User Documentation
The user documentation consists of the following sections:
Introduction
This guide helps the business user configure the Xtivia Dashboard Framework for everyday use. The Getting Started section assumes you are starting with a clean page. If you have already been provided a dashboard page with Chart portlets, you can skip the Getting Started section. In addition, we make use of various examples that are based on sample data provided with the framework. This data may or may not be available to you on your own system.
The Star-Schema Data Model
Let’s talk briefly about how the Xtivia Dashboard Framework deals with the data you’ll be displaying. There are many different ways of organizing access to your data. To simplify matters, the Dashboard Framework makes use of the common star schema to organize your data.
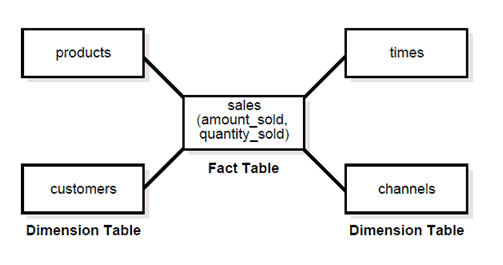
A star schema organizes your data into a set of facts, such as the amount or quantity of sales, and dimensions, which provide critical information associated with the facts. So for instance, if you’re looking at sales, you would be interested in the dimensions of products, customers, sales channels, etc, that are part of the detail of each sale. You can then display interesting details about what product was sold when, which sales channel has the most customers, and so on. This organization of dimensions surrounding facts at the center is the reason this approach is called the star schema (see diagram).
For more information, simply search the web for star schema or check out this Wikipedia article as a starting point: http://en.wikipedia.org/wiki/Star_schema
Getting Started
The Xtivia Dashboard Framework consists of two types of portlets – Chart portlets and Filter portlets. We’ll talk about Filter portlets later, but the important thing to note about both types is that they follow the normal rules for portlets in the Liferay portal. You can drag and drop the portlets on the page to get the right arrangement, use page layouts to divide up the page into columns, customize the portlet settings, etc. So in general the Dashboard Framework should appear familiar to you. If not, ask your Portal Administrator for pointers or a 5-minute tutorial.
Your Portal Administrator or developer should also provide you some configuration information as a result of configuring the Dashboard Framework for your organization’s data. This information defines what is called a data source throughout the documentation, and it is possible to have multiple data sources.
For each data source, you should have the following items. These are actually URLs, the same sort of address you type in your web browser.
- Chart metadata URL
- Filter value URL
- (optional) Chart data URL
To get started, open the page for your dashboard. Since we’ll add multiple portlets, you may want to select a two or three column layout for the page. From the Add | More | Xtivia menu, drag and drop a Chart portlet onto your page. Initially the portlet will display a message that it needs configuration, so let’s do that. On the title bar of this portlet, find the wrench icon for Options and then select Configuration. Simply copy the first two URLs you obtained from the administrator, copy them into the text boxes, and click the Load Metadata button.
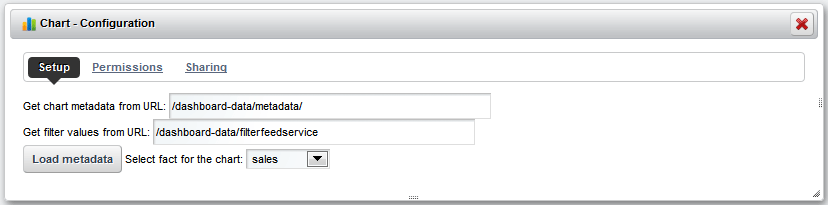
If you entered the data source URLs correctly, the configuration screen will now show a drop down list with the facts from your data model (see above). In our example, we have two facts – sales and socSales. As soon as you pick a fact from this list, you’ll be able to configure the chart.