User Documentation
The user documentation consists of the following sections:
Chart filters
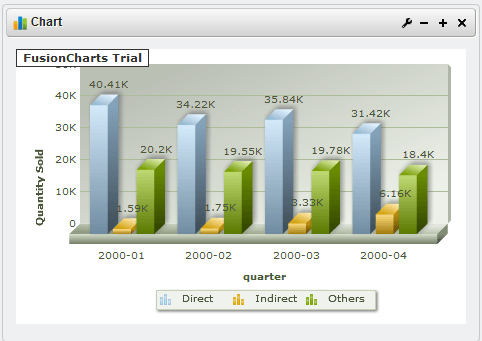
So what do you do if your data warehouse has 10 years of data and you’re just interested in one year or two months? We’ve made it easy to filter the data so you just see what you really want. We’ll use time as an example, but of course you can apply other filters as well.
Towards the bottom of the configuration screen there are several filters defined. These filters are automatically configured based on the dimensions in your data model. Say you want to only see data for the year 2000. Find the filter marked Time, select the Year attribute from the dropdown, and click the button marked Select Values. Select the year 2000 and the popup box closes, then click Save on the configuration screen. You now are displaying data just for the year 2000.
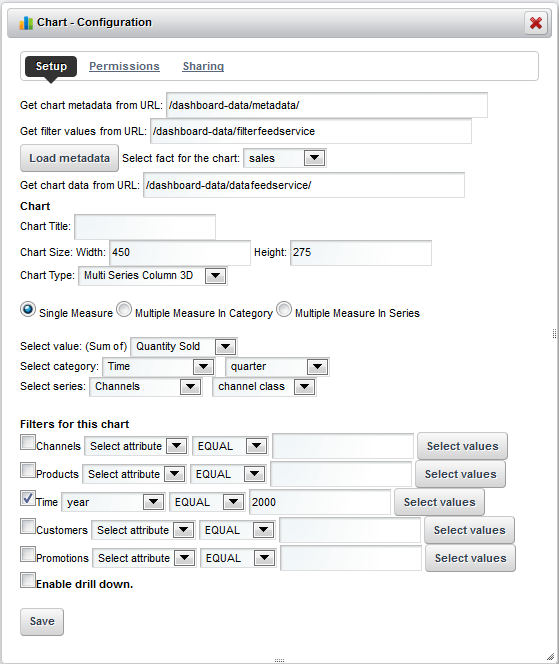

Filtering Multiple Values
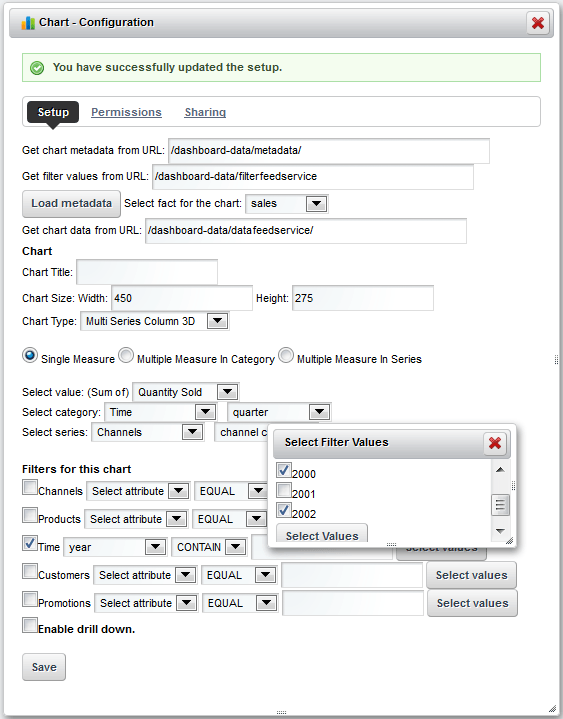
What if you want to show 2002 as well as 2000? Take a closer look at the filter line and you’ll notice the EQUALS box is actually a dropdown. Pick CONTAINS from this list and then click on the Select Values button. You’ll be presented with a popup list of values, in this case years. Pick the years you’re interested in (2000, 2002) and scroll down to the Select Values button within the popup. The values popup will close. Click Save and you’ll now see the chart includes both years.
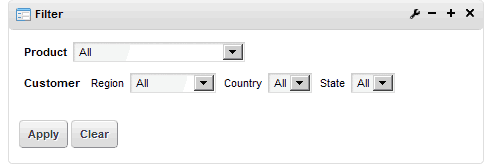
Page Filters
So far we’ve talked about using individual Chart portlets on a page, including customization and filtering. This isn’t bad if you have just a couple of Charts on your page, but what happens if you have 10 or more charts on a page and want to narrow your focus on a particular time or region? You could certainly use the filter capabilities of each individual portlet, but that’s tedious and error prone.
The Xtivia Dashboard Framework provides a second type of portlet called the Filter portlet. Unlike the independent Chart portlets, you can only place one Filter portlet on a page, and configuration of this portlet affects all the Chart portlets on the page. In a sense, it controls all the Chart portlets on the page. And as we’ll learn in a later section, this allows the customization of what is displayed by the Chart portlets.
The Filter portlet allows you to define and use data filters, in much the same way you can define filters in individual Chart portlets. However, the filters from the Filter portlet are always applied first, before any filters associated with individual Chart portlets on the page. This allows you, for instance, to only show results for the year 2000 or stores in region 41. Filters are always associated with a dimension of your data model.
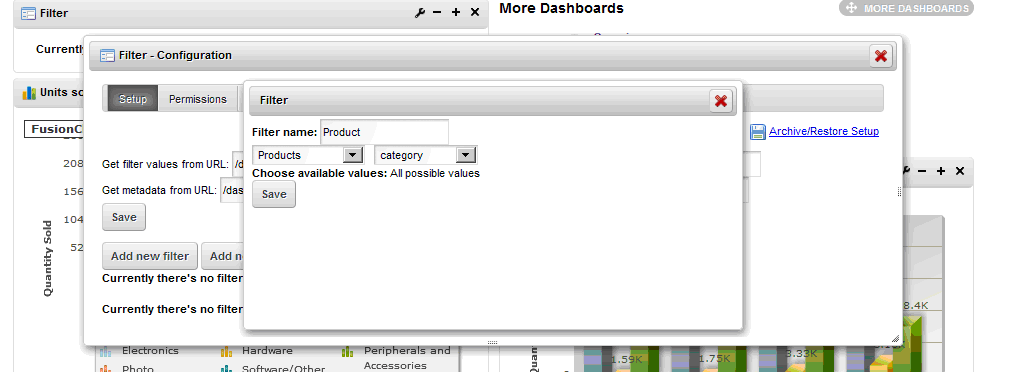
For example, let’s create a filter to select product categories. First, if you don’t have a Filter portlet on your page, drag a Filter onto the page. Next, locate the portlet configuration screen as you did with the Chart portlets (find the wrench icon for Options and then select Configuration). Click on the button marked Add New Filter, give the filter a name like Product or Product Category, select the Products dimension and Category attribute from the dropdowns, and click Save.
Now you have a filter that will affect all the Dashboard portlets on the page. Close the configuration screen and notice the filter. By default, the filter is inactive. To activate the filter, simply select a product category like Electronics, click the Apply button, and all the Chart portlets will get updated to only show data for this category. To stop filtering, simply click the Clear button.
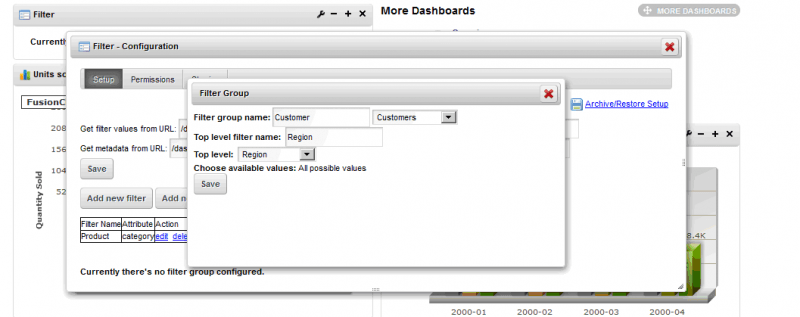
Filter Groups
You may also want to create filter groups. Filter groups allow you to focus in on a natural hierarchy of dimension attributes. For instance, perhaps you’re interested in where customers are located, and at various time you want to focus on the customer’s region (Asia, Europe, etc.), country, and state. These attributes form a natural hierarchy.
To create a filter group with region, country, and state, we first need to go to the configuration screen. Then,
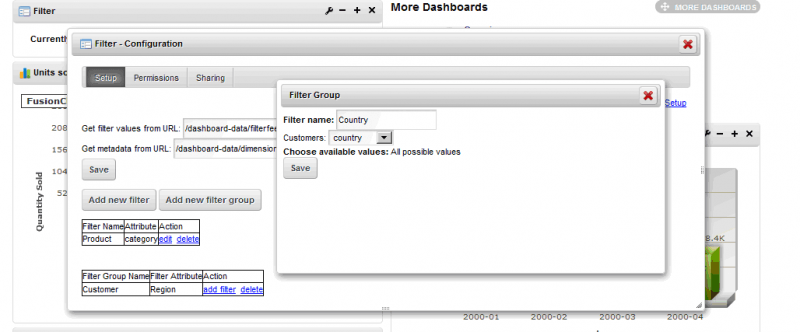
- Add the filter group and first filter. Click the Add New Filter Group button and enter the filter group name (“Customer”) and select the dimension (“Customers”). Then add the first (top-level) filter from this screen. Enter Region for the filter name and select Region from the dropdown. Click the Save button and you’ll see the new filter group.
- Add the second filter to the filter group. Without leaving the configuration screen, find the filter group you just added and click the Add Filter link next to the filter group (not the button above). Enter the name (“Country”) and select the attribute (“Country”). Click the Save button.
- Add the third filter to the filter group. Without leaving the configuration screen, click on the Add Filter link next to the filter group. Enter State for the name and select State for the attribute. Click Save.
Close the configuration screen and you now have a filter that works with the region, country, and state attributes. To use the filter, select a value from the left (top-level) attribute, region. Note that until you select a region, there are no values available in the country dropdown. Furthermore, if you pick Asia for the region, the country dropdown will only have Asian countries and none from Europe.