
JConsole is a monitoring tool which comes with JDK, and complies to the Java Management Extensions (JMX) specification. JConsole uses the extensive instrumentation of the JVM to provide information about the performance and resource consumption of applications running on the Java platform.
Traditional Way of JVM Monitoring
The traditional way of using JConsole requires exposing the JMX Service URL of a monitored JVM to a monitoring host. JConsole on the monitoring host needs to access the monitored JVM via Java RMI. But if they are distributed in different networks, a firewall could block the RMI access coming from the outside of the production network.
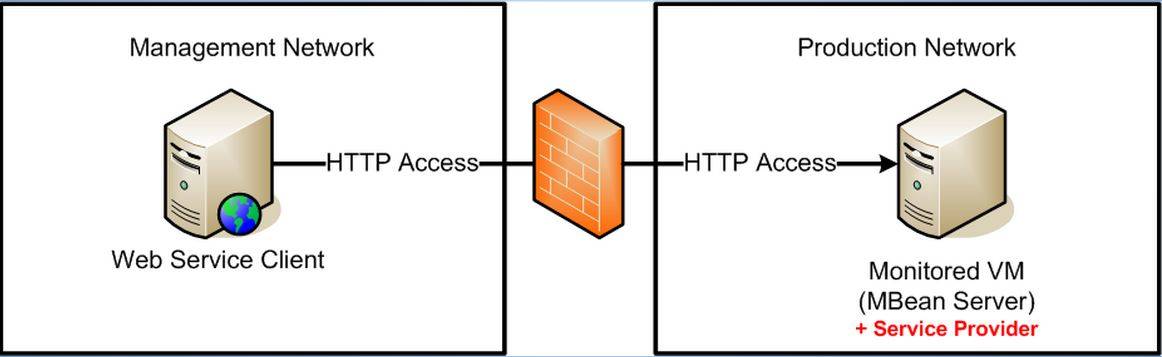
Web Service Connector for JMX
As a secondary choice for JConsole users, JSR-262 provided a specification for web service connectors for JMX. We can find multiple implementations of JSR-262, like the ws-jmx-connector project (see: https://ws-jmx-connector.java.net/). All of these implementations require deploying some extra jar files on the monitored server. But sometimes we don’t have full access to the monitored JVM, so deploying extra libraries could be restricted.
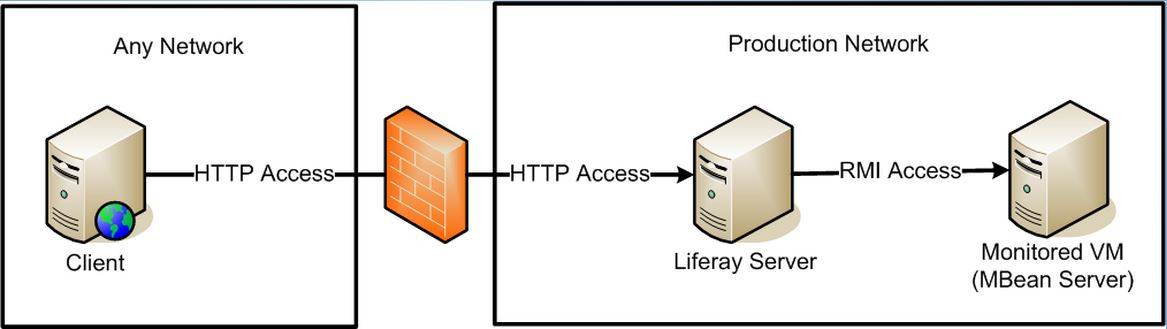
JConsole Portlet
If we have a Liferay instance running in the production network, we can use the JConsole portlet we developed to monitor any JVM that has the JMX service exposed to the Liferay server.
The JConsole portlet provides a graphical chart view of JVM heap memory usage, non-heap memory usage, CPU usage, loaded classes and threads. It uses a time-based polling mechanism to get chart data from the monitored server, and uses Google Chart to generate real-time graphics of system resources. It also uses client storage and a JMX connection pool to avoid performance bottlenecks.
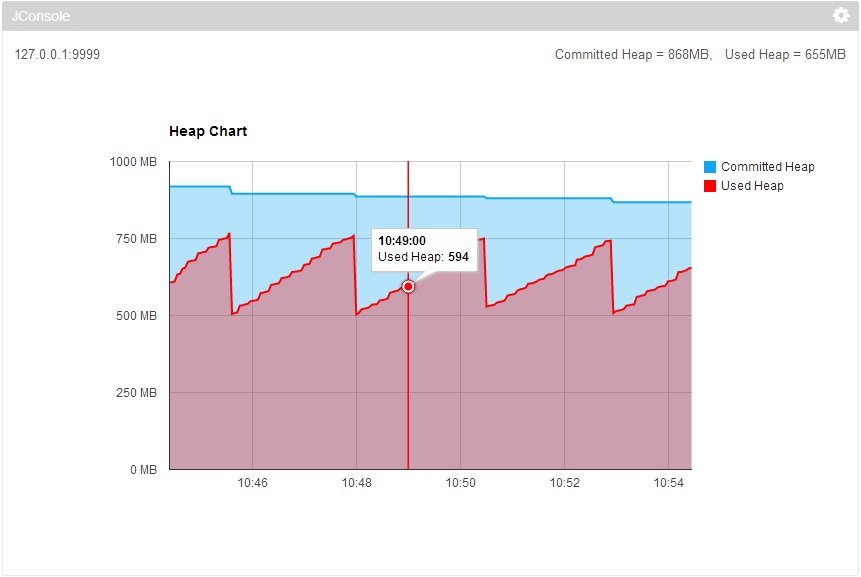
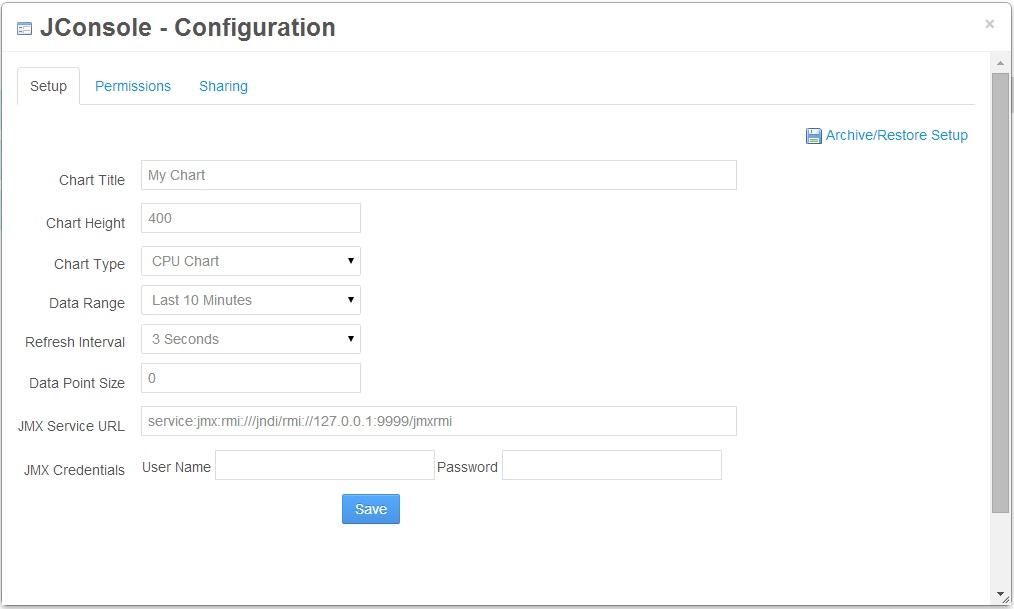
We have several configuration options available on the JConsole portlet configuration page, including chart title, chart height, chart type, data range, refresh interval, data point size, JMX service url and JMX credentials. By selecting different chart types, we can show different system resource graphics to the user, for example, heap chart, CPU chart, thread chart, and etc. By selecting a data range, we can specify data scope of the charts. We can also specify the refresh interval on the configuration page.
By using the JConsole portlet, we can provide extensive monitoring capabilities to administrators (and users, given appropriate portal permissions), without having to open the firewall for JMX services. And it doesn’t matter if the monitored JVM’s are local or remote.
Visit the Liferay Marketplace to download.
For More Information
For more information about expert help with your Liferay implementation, check out https://www.xtivia.com/portal/liferay-portal, or contact us at https://www.xtivia.com/contact-us.