
Summary
Salesforce Historical Trending transforms static records into actionable intelligence by comparing current data against past snapshots, enabling organizations to proactively identify shrinking sales deals, pinpoint service bottlenecks, and validate process changes over time.
- Pipeline Visibility: Sales leaders can detect risk immediately by tracking changes in opportunity amounts and close dates, allowing them to distinguish between healthy prospects and stalled deals before revenue is lost.
- Service Optimization: The feature exposes operational inefficiencies by monitoring how long cases remain in specific statuses, helping managers identify why resolutions are delayed or require excessive transitions.
- Administrative Control: Administrators can configure specific fields for daily or weekly snapshots to maintain a rolling three-month window of historical data, ensuring high system performance while respecting strict storage limits.
By enabling this feature, businesses can shift from reactive reporting to proactive management, utilizing irrefutable historical evidence to coach teams and drive data-driven growth.
Table of contents
Introduction
Every business relies on data to guide its future, but a single, current data point only tells half the story. To truly drive strategic growth, organizations need to understand movement—how are their key metrics changing over time? This is where Salesforce Historical Trend Reporting shines. This powerful feature transforms static, transactional data into actionable, strategic knowledge by efficiently capturing and comparing current values with specific past snapshots. By understanding the distinction between live and historical data, businesses can move from simply reacting to past events to proactively spotting shrinking deals, identifying process bottlenecks, and coaching teams with irrefutable historical evidence. This guide will walk you through the fundamentals, key use cases in Sales and Service, and the administrative steps required to implement this foundational tool for modern, data-savvy decision-making.
The Fundamentals: Current Data vs. Historical Data
To understand Historical Trending, you must understand the distinction it draws in reporting:
The Current Value is the live, up-to-the-minute data from a Salesforce record. If a sales opportunity is currently valued, that’s its current value. And the Historical Value (Past Snapshots) is the value of the same field (e.g., the opportunity amount) captured at a specific point in the past, such as the end of last week. Salesforce takes efficient, regular snapshots of this data, storing the old values alongside the current ones.
A Historical Trend Report literally displays these two points in time side by side. This structure allows users to easily calculate movement, growth, or shrinkage, providing a clear answer to the fundamental business question: “Did this number go up or down, and by how much, since our last check-in?”
Where do Historical Trends shine? While this feature can be used on a few select objects, it is most frequently used to drive strategic decision-making in Sales and Service operations. Examples include:
Mastering the Sales Pipeline (Opportunities)
The sales pipeline is the lifeblood of revenue. Historical Trend Reporting is indispensable for managing the pipeline effectively:
- Spotting Shrinking Deals: Did the value of an opportunity drop over the last two days? The report highlights this change immediately, allowing sales leadership to investigate and address the issue before the deal is lost.
- Identifying Pushed Deals: By tracking changes to the Expected Close Date field, reports can reveal deals that are constantly being moved to a later month. This helps sales managers distinguish between genuine prospects and stalled or unlikely-to-close deals.
- Analyzing Flow: Comparing the number of deals in the “Negotiation” stage this week versus last quarter helps a company understand if its sales process is speeding up or slowing down.
Evaluating Sales Forecasts
Forecasting involves predicting future revenue. Historical Trend Reports allow management to evaluate the accuracy and behavior of their forecasting process:
- It tracks how team members’ forecasted amounts change from week to week. Consistent, drastic changes can indicate poor initial qualification or a need for better training in making revenue predictions.
- This analysis turns raw predictions into coachable moments for sales representatives, improving overall financial planning.
Tracking Service Cases
In customer service, speed and efficiency are paramount. Historical trending can monitor Case records:
- Identifying Stuck Cases: A report can flag cases that have been sitting in the “Pending Customer Response” status for an unusually long time compared to a historical benchmark.
- Analyzing Status Transitions: By tracking changes in the Case Status field over three months, service leaders can determine whether cases are taking too many steps (transitions) to reach “Closed” status, suggesting process bottlenecks.
So, how is the data collected and reported? Historical Trend Reporting uses a structured and efficient method to avoid overwhelming the system with excessive logging.
Data Capture Logic
- Snapshot Frequency: Salesforce periodically takes an intentional “snapshot” of the data for fields enabled for trending. This is typically done daily or weekly, focusing only on specific fields chosen by the administrator.
- Time Window: To keep reporting fast and focused on recent behavior, Salesforce retains this historical data for a limited time —primarily the last 3 months and the current month. This window is generally sufficient for operational analysis and trend spotting.
- Performance Limits: There are strict limits on the number of historical data rows that can be stored per object (e.g., millions). These limits are in place to ensure system performance remains high. Administrators are notified if they are near the limit.
Report Creation
To access this wealth of historical information, users must create a specialized report type, like Opportunities with Historical Trending. Within this unique report:
- Historical Fields are Key: You work with special fields such as Amount (Historical) and Close Date (Historical).
- Comparison Dates: You can specify up to five distinct past dates (snapshots) to include in your report. This allows you to perform a direct comparison across multiple points in time—for example, comparing the deal value on the 1st, 15th, and 30th.
- Data Visualization: Results are typically presented in charts and tables, often with red or green highlights to indicate whether a value has increased (green) or decreased (red) since the comparison date.
The strategic edge, in essence, is that Historical Trend Reporting transforms raw transactional data into strategic knowledge. It allows organizations to:
- Move from Reactive to Proactive: Instead of reacting to a quarterly loss, they can track the gradual shrinkage of the pipeline as it happens and correct course immediately.
- Validate Processes: It provides objective, quantifiable evidence of whether changes to a sales or service process are having a positive or negative impact.
- Drive Accountability: By visualizing individual or team trends, managers can coach performance with irrefutable historical data, fostering a culture of data-driven decision-making.
The ability to look backward with precision is the key to managing and improving the future, making Salesforce Historical Trends a foundational tool in any modern, data-savvy business.
Enabling Historical Trends
As a Salesforce Administrator, enabling Historical Trend Reporting is a crucial task. It involves configuring the system to begin taking the necessary data “snapshots.” Unlike simple field history tracking, this feature requires specific setup to ensure performance and capture the most relevant data.
Here is a step-by-step guide for an Administrator to enable Historical Trending, focusing on a Custom Object (though the steps are nearly identical for standard objects like Case or Opportunity).
How to set up Historical Trend Reporting
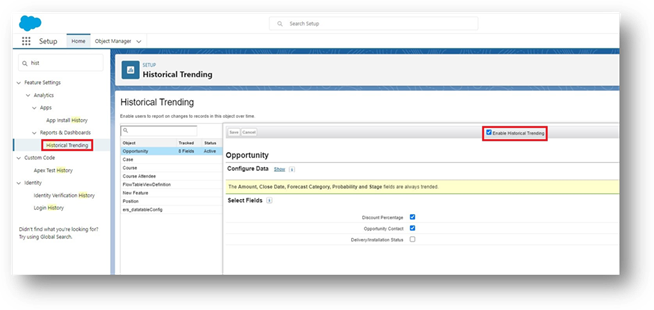
- Go to Setup
- Type Historical Trending in the Quick Find box
- Choose the object that you want to activate Historical Trending
- Click Enable Historical Trending and select the fields that you want to track
- Go to your homepage
- Click on the Reports tab
- Select all in the Category column on the left
- Search for Historical
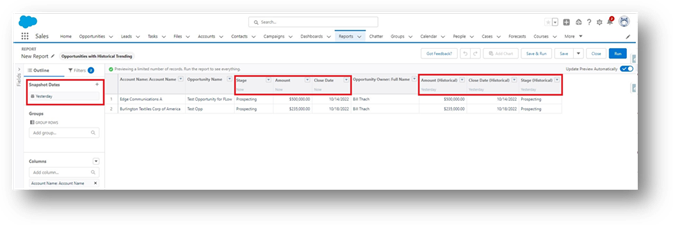
- For our example, we activated this feature on Opportunities so that we will click on the report type: Opportunities with Historical Trending
- Click Start Report
- In the 2nd image:
- Snapshot Dates: On the left, you will see where you can specify your snapshot date that you want to compare your historical trends
- In the middle, you’ll see three columns: Stage, Amount, and Close Date, and their current values
- To the right, you’ll see the same columns with the historical data
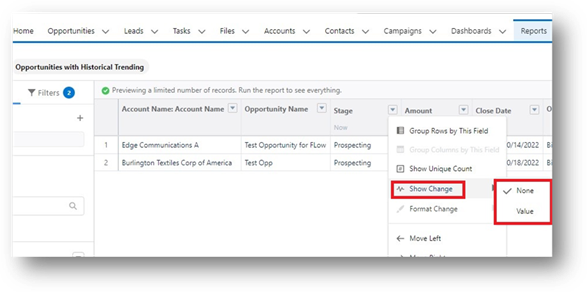
- In the 3rd image, you can choose to show the values in changes
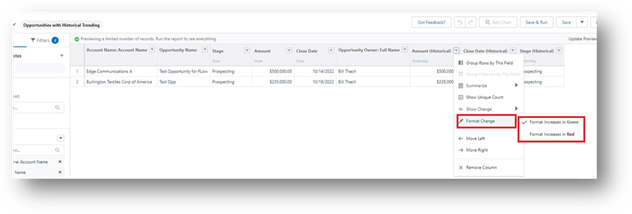
- In the 4th image, you can choose to visualize the changes in different colors. Choose either:
- Format Increases in Green
- Format Increases in Red
Key Administrative Limitations to Note
For any administrator, understanding the “rules” of Historical Trending is just as important as the setup steps:
- Timeframe: Historical data is generally kept for the last three full months plus the current month. It is a rolling window, not a permanent archive.
- Field Type Support: Only certain field types can be tracked, primarily Number, Currency, Date, Picklist, and Lookup. Formula fields are not supported for historical trending.
- Report Format: Historical Trend Reports must be created using the Report Builder and are best viewed using charts and groupings (tabular views are restricted in Lightning Experience). The standard Summary report format is not supported.
- Data Volume Limit: Be mindful of the five million-row limits on historical data per object. Using the filters in Phase 2 is essential to avoid hitting this performance ceiling.
Need help creating a historical data report? Our certified Salesforce CRM experts are available to assist you. Consider XTIVIA your trusted guide throughout your Salesforce CRM implementation. Don’t forget to inquire about our Salesforce CRM Admin On-Demand service.
Give us a call today!