
Introduction

A picture is worth a thousand words! This popular adage refers to the notion that a complex idea or dataset can be conveyed with just a single image. It has been observed that people relate to images quicker than just looking at tabular data. Effective visualization helps users in analyzing and reasoning about data and the correlation in the data for one or more variables. We present the XTIVIA Dynamic Data List Visualization Portlet to assist in such visualizations.
The purpose of the XTIVIA Dynamic Data List (DDL) Visualization Portlet is to allow users to view a graphical representation of data entries made using Liferay’s out of the box Dynamic Data List portlet.
For the purpose of demonstrating the DDL Visualization Portlet, we have used the concept of project issues tracking. A user is required to create a DDL with as many fields as needed but must include at least one select field. Charts are created from the select fields of the DDL. Using the DDL Visualization Portlet preferences, the user can configure which select fields will be used for creation of the charts. Users may want to see a graphical representation of all issues belonging to a specific project in a projects charts. Users may also want a representation of how many issue types are bugs, stories, tasks etc, in an issues type chart. In this case the DDL is created such that it allows the entry of issues specific to a selected project.
The data definition for the DDL can have the following fields:
- Project – A select field with the different projects as options.
- Issue Type – A select fields with the issue types as options e.g., Bug, Task etc.
- Priority – A select fields with priorities as options eg Major, Minor etc.
- Issue Status – A select fields with status options eg To Do, In Progress etc.
- Summary – A text field.
- Description – A text field.
The DDL Visualization Portlet is currently built for Liferay versions 6.2 EE and CE. It displays pie charts with predefined widths and height. Please contact XTIVIA at https://www.xtivia.com/contact-us for 6.1 CE/EE versions or specific enhancements such as the ability to change the width and height, ability to change the type of the chart used (bar chart, histogram, line chart), etc.
Get Started
- Start with either the Liferay 6.2 EE or CE version. Install the portlet from the Liferay Marketplace.
- Create a Dynamic Data List (DDL):
- Login as admin. Click the Admin menu, located at the top right corner and then select Content.
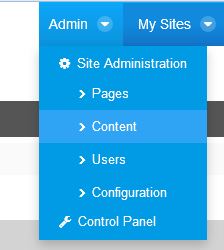
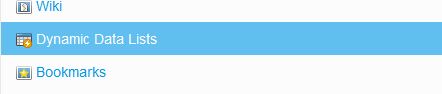
- Click on the Dynamic Data Lists link.
- Before adding a new DDL, create a Data Definition (DD). To create a DD, click on Manage Data Definitions. A modal window will show up.
- Click on the Add button to create a new DD.
- Enter the name and description. Scroll down to the empty canvas to construct definition. There is a set of drag and drop fields at the left to use for construction.
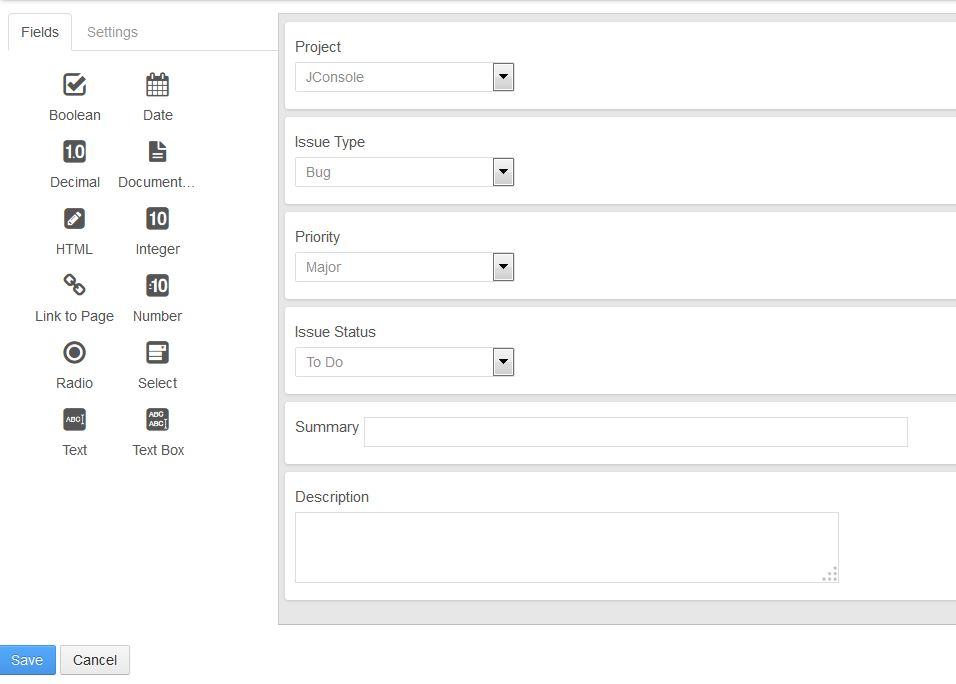
- Charts are created based on select fields. Make sure there is at least one field selected.
- Save your changes and navigate back to DDL page. From this page click on the Add button.

- Enter the DDL name and description and then select the Data Definition you created in Step V. Then Save.

- Login as admin. Click the Admin menu, located at the top right corner and then select Content.
- Make DDL record entries. Entries can be made either from the Control Panel or by using the Dynamic Data List Form Portlet.
- Using the Control Panel:Navigate to DDL and select the DDL you will like to make entries to. Click the Add button
 Fill out the form and click Publish.
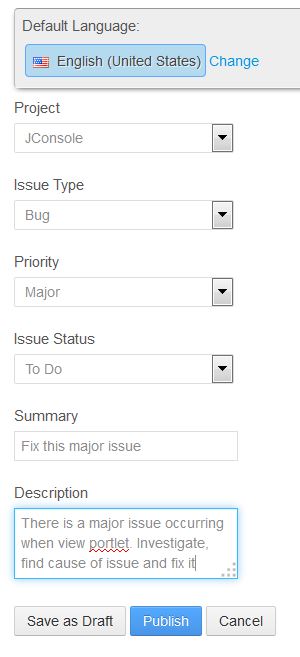
- Using Dynamic Data List Form:You will need to deploy the DDL Form portlet if you don’t already have it. Add the portlet to page and then configure with the targeted DDL. Make sure you check the Allow Multiple Submissions checkbox. Navigate back to the portlet view and add entries.
 Configure the DDL Visualization Portlet:
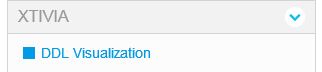
- Add the DDL Visualization Portlet to a portal page. The portlet is located under the XTIVIA category.
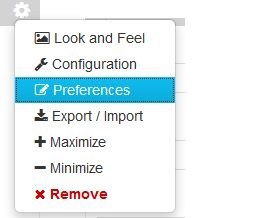
- Go to portlet preferences to configure the portlet.
- From the portlet preferences select the DDL created in the previous step. This is the DDL that will be used to create the charts. On the selection a list of checkboxes will display allowing you to select the fields to use as charts. These are all the select fields within the Data Definition that the DDL is associated with.
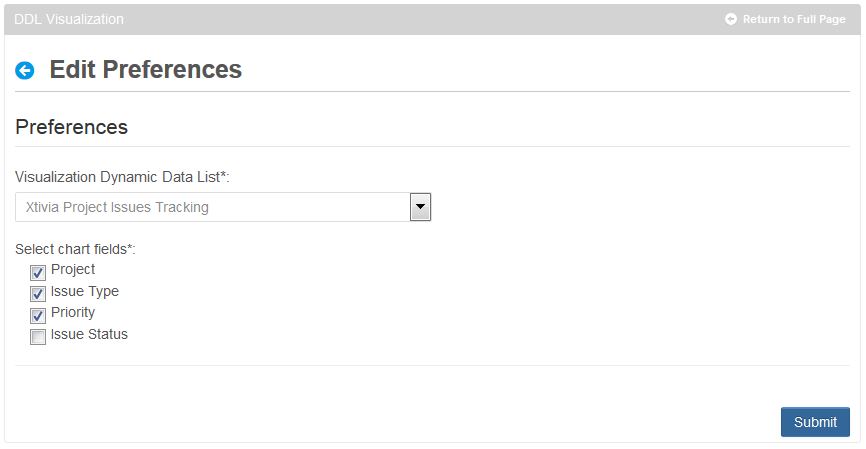
- Click the Submit button to save your changes.
- Navigate back to the portlet view.
- Add the DDL Visualization Portlet to a portal page. The portlet is located under the XTIVIA category.
- Using the Control Panel:Navigate to DDL and select the DDL you will like to make entries to. Click the Add button


Viewing The Results
Depending on what you’re interested in, there are different ways to view the DDL Visualization Chart and DDL Entries.
- View Charts: After making at least one DDL entry, the charts get populated with data. Go to the DDL Visualization Portlet to view the charts.

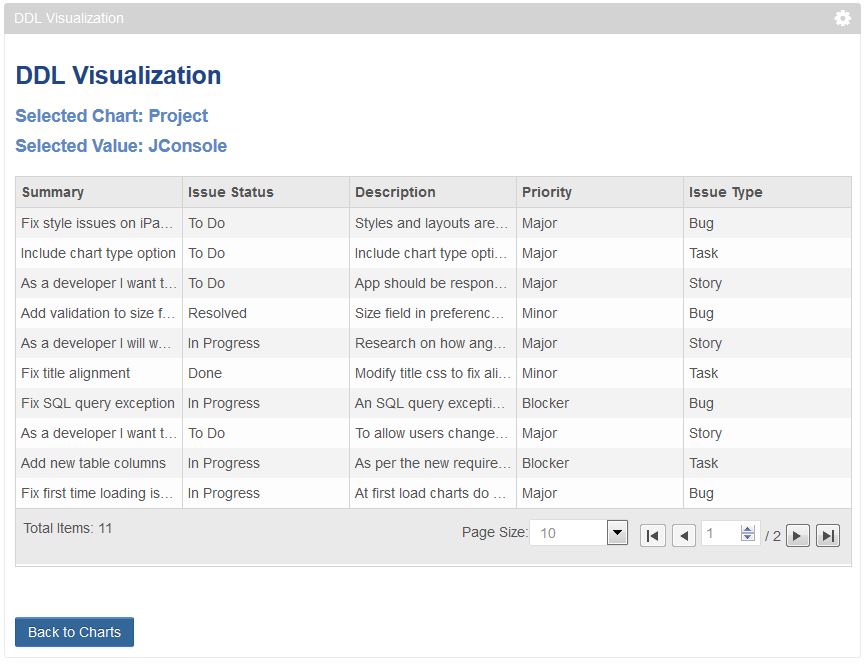
- View Entries per selected value/section: You can view a list of all entries under a selected value or section. For example, by clicking on the JConsole section of the Project pie chart, the portlet will display all entries that have their project value as JConsole.
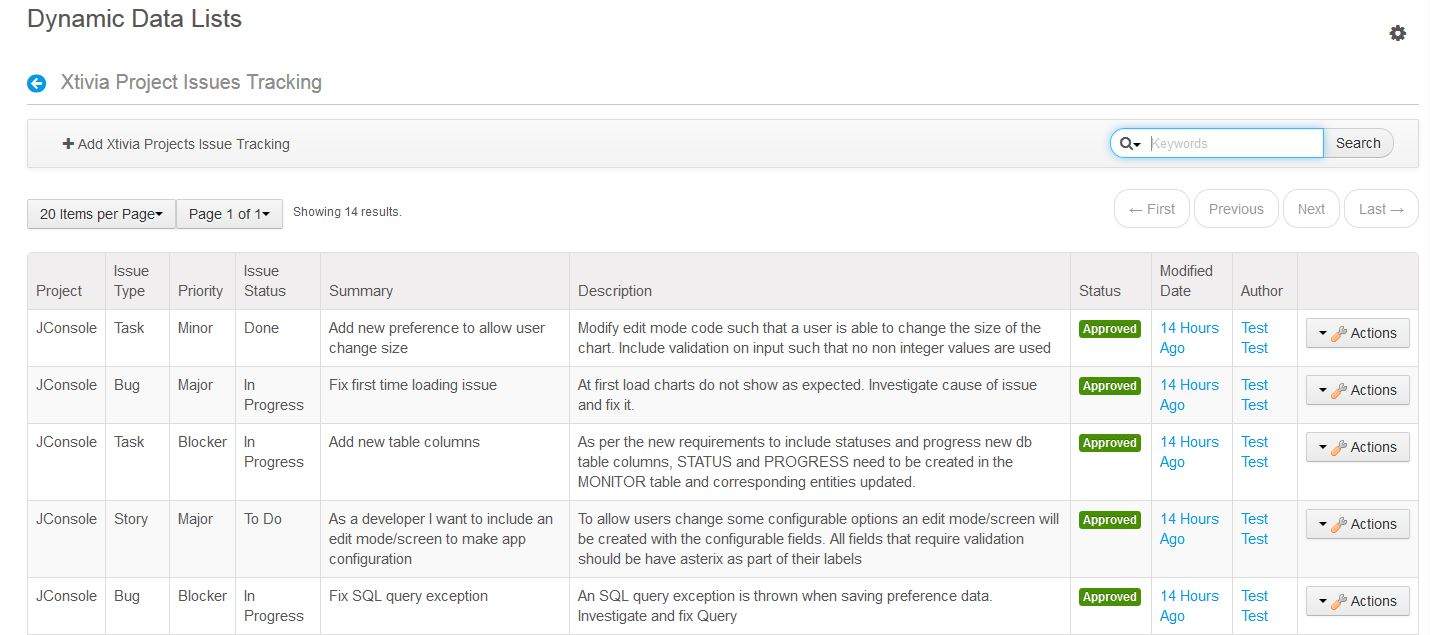
- View all entries for selected DDL: You can view all entries made for a particular DDL. Entries can be viewed from the Control Panel or with the Dynamic Data List portlet.
- Viewing from Control Panel: Navigate to DDL in the Control Panel and then select the DDL whose entries you will like to view.
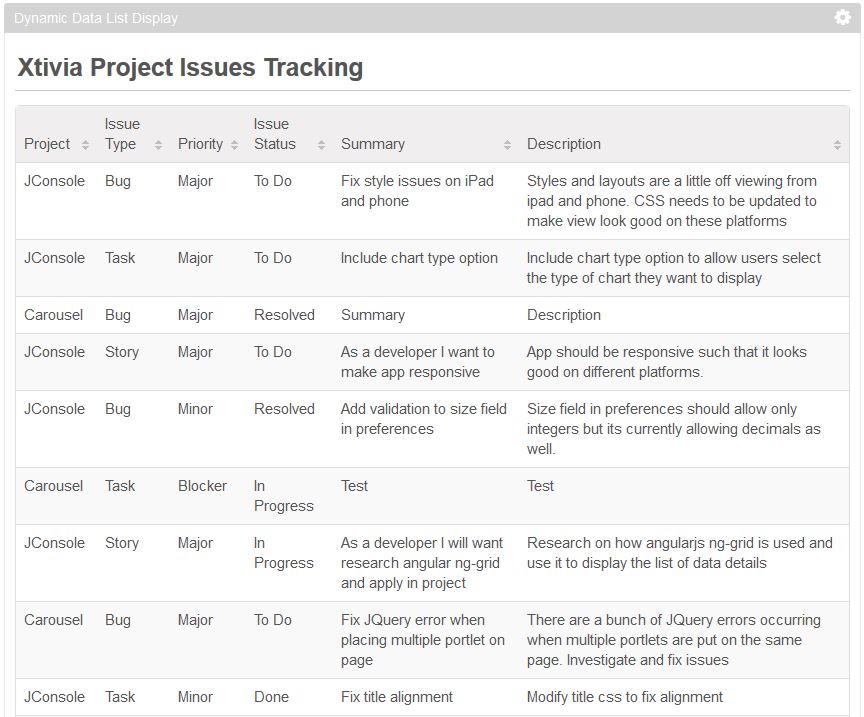
- Viewing from DDL Display Portlet: Add the portlet to a page and configure it with the target DDL. Entries will show in portlet view mode.
- Viewing from Control Panel: Navigate to DDL in the Control Panel and then select the DDL whose entries you will like to view.
Visit the Liferay Marketplace to download.