
SUMMARY:
- Purview scores Fabric lakehouse tables against rules you set, then rolls the scores up to data products and governance domains so owners can see data health.
- It works only on lakehouse, shortcut, and mirrored data in Delta or Iceberg format, and only on tables you’ve added to a governance domain or data product.
- Purview reports problems after data lands. It doesn’t stop a bad load, so you still need tests in your Fabric pipelines.
- Data quality runs are billed on pay-as-you-go processing units, so the number of rules and how often you run them drive the cost.
Table of Contents
- What Fabric Data Quality Purview Can Measure
- How Purview Scores Roll Up to Data Products and Domains
- How Error Records and Alerts Turn Scores Into Fixes
- What the Fabric Data Quality Purview Can’t See
- Why You Still Need Tests in the Pipeline
- What Purview Data Quality Costs in Fabric
- How to Start Measuring Data Quality in Fabric With Purview
- When Purview Data Quality Isn’t Worth It Yet
What Fabric Data Quality Purview Can Measure
The Fabric data quality Purview can measure covers six common checks: completeness, consistency, conformity, accuracy, freshness, and uniqueness. Microsoft Purview runs rules against lakehouse tables and gives each table a score from 0 to 100 (Microsoft Learn).
The feature lives in Purview Unified Catalog, Purview’s business catalog. A data quality steward, the person who owns quality rules, sets it up in four steps:
- Profile the table. Profiling takes a quick statistical snapshot of each column. It shows things like minimum and maximum values, how many blanks there are, and how many duplicates.
- Add rules. Built-in rules check for blank fields, duplicate rows, unique values, data types, text formats, and freshness. A table lookup rule checks values against a reference table. Purview can also suggest rules based on the data.
- Write custom rules where needed. Custom rules use simple expressions or Spark SQL. An example is “fare amount must be positive when the payment type is card” (Microsoft Learn).
- Schedule the scan. Scans can run hourly, daily, weekly, or monthly.
Each rule’s score is simple. It’s the share of rows that pass. A table with 10,000 rows and 500 failures scores 95 on that rule.
 Purview data quality is a scoreboard, not a gate. It tells business owners how healthy their Fabric data is after it lands. It doesn’t stop bad data from getting in.
How Purview Scores Roll Up to Data Products and Domains
Purview scores roll up in four levels: rule, data asset, data product, and governance domain. Each level is a plain average of the level below it (Microsoft Learn). That lets an executive see one number for Finance, then drill down to the table that’s dragging it down.
Here’s how the levels fit together:
- A data asset is one table. Its score is the average of the rules applied to its columns.
- A data product is a set of tables and reports grouped for one business use. Its score is the average of its tables.
- A governance domain is a business area, such as Finance or Sales. Its score is the average of its data products.
Rules you leave in draft don’t count. A freshness rule scores either 0 or 100, because data is either current or it isn’t. Purview keeps a trend line for each table’s last 50 runs.
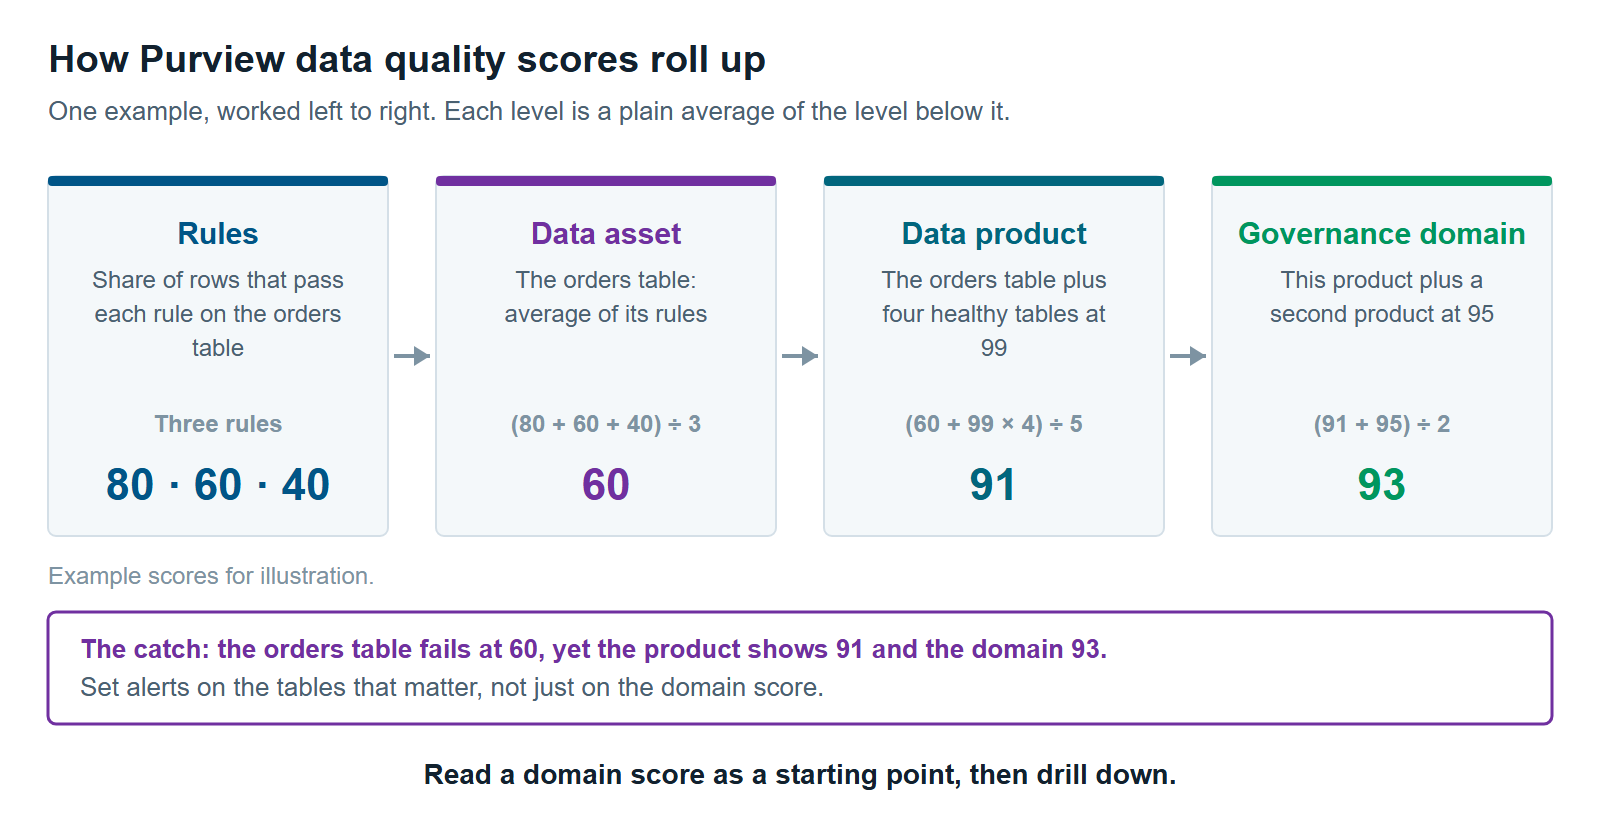
Averages have a catch. Say a data product has four healthy tables at 99 and one critical table at 60. The product still scores about 91. Read domain and product scores as a starting point, then check the tables that matter most.
How Error Records and Alerts Turn Scores Into Fixes
Error records and alerts make a score something a team can act on. An alert tells someone a score dropped. Error records show exactly which rows failed and why.
Alerts. You set a score threshold and choose the data products and tables it watches. When a scan scores below it, Purview emails the data owners and stewards, or a distribution list (Microsoft Learn). Purview also lists each problem as an action, with a query that helps a steward find the bad data.
Error records. When you turn on publishing of failed rows, Purview writes the rows that broke a rule to storage you own. For Fabric, that can be a lakehouse. Each failed row keeps all its original columns plus the rule, run, and data product it belongs to (Microsoft Learn). Teams can query the failed rows or build a Power BI report on them.
A few limits apply. Purview publishes up to 100,000 failed rows per rule per run. For Fabric, error storage has to be set up in your Purview account’s region. If it isn’t, the scan still succeeds, but Purview skips publishing the failed rows (Microsoft Learn). A successful scan doesn’t prove the rows were saved, so check the storage settings before you rely on them.
What the Fabric Data Quality Purview Can’t See
The Fabric data quality Purview can’t see falls into four gaps. It doesn’t stop bad data. It skips some Fabric items. It can’t easily compare tables. And it only checks what someone added to a data product.
It runs after the fact. It scans read data that’s already in the lakehouse on a schedule. By the time a score drops, a report may already show the bad numbers.
It covers some Fabric items, not all. Microsoft’s supported-source list names Fabric lakehouses, shortcuts, and mirrored databases. Shortcuts also reach Amazon S3, Google Cloud Storage, and Dataverse. Tables must be in Delta or Iceberg format (Microsoft Learn). The list doesn’t include Fabric warehouses, SQL databases, semantic models, or reports.
It checks one table at a time. Custom SQL rules can’t join tables. A table lookup rule works only when the reference table sits in the same governance domain. So a check like “every order has a matching customer” across two domains needs another tool.
It only scores what’s in a data product. You can profile and scan only tables that someone has added to a governance domain, usually through a data product. Data nobody has organized yet doesn’t get a score. Our article on Governance Domains and Data Products: Mapping Fabric Domains to Purview covers how to set those up.
There are setup conditions too. Purview’s managed identity, the identity Purview uses to sign in, needs Contributor access to each Fabric workspace it checks. Your Purview account and the data must be in the same Azure region. Contributor can change items in a workspace, so agree on that access with your security team early.
Why You Still Need Tests in the Pipeline
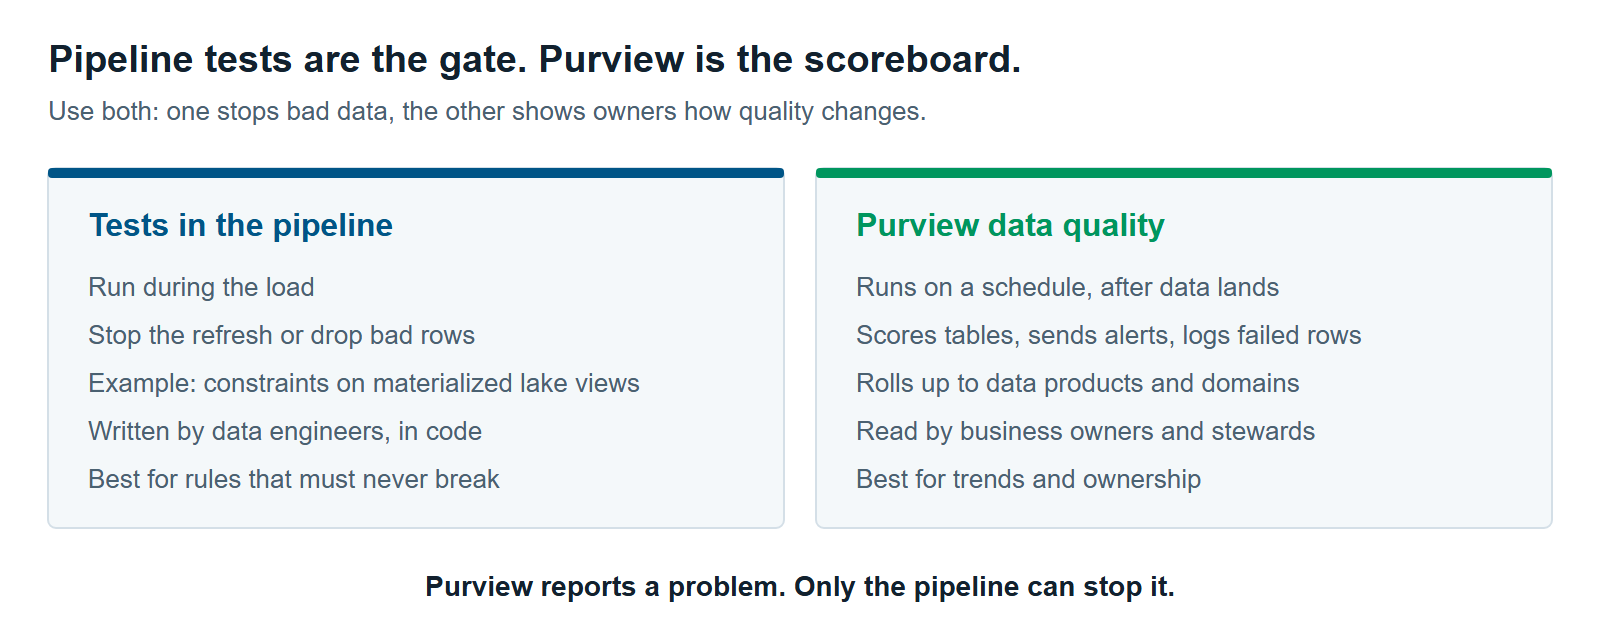
You still need tests in the pipeline because they can stop bad data before anyone sees it. Purview can’t. Pipeline tests protect the load. Purview reports on the result. A mature setup uses both.
Fabric has its own way to test data as it moves. Materialized lake views, which are tables Fabric keeps up to date from a query, can carry data quality constraints. A constraint is a rule each row must pass, such as “customer name isn’t blank.” When a row fails, you choose what happens. FAIL stops the refresh. DROP removes the row and keeps going, and Fabric’s lineage view shows how many rows were dropped (Microsoft Learn). Engineers can also add checks in notebooks and pipelines.
The two approaches answer different questions:
| Tests in the pipeline | Purview data quality | |
|---|---|---|
| When it runs | During the load | On a schedule, after data lands |
| What it does | Stops or drops bad rows | Scores, alerts and logs failed rows |
| Who it’s for | Data engineers | Business owners and stewards |
| Where rules live | In code, next to the pipeline | In Unified Catalog, next to the data product |
| Best at | Hard rules that must never break | Trends, ownership and reporting up |
A missing data quality strategy is anti-pattern #11 in The 12 Most Common Microsoft Fabric Anti-Patterns We See Across Every Assessment. Purview fills part of that gap. It doesn’t fill all of it.
What Purview Data Quality Costs in Fabric
Purview data quality costs depend on how many rules you run, how much data they read, and how often. It’s billed on data governance processing units (DGPUs). One DGPU is 60 minutes of managed compute (Microsoft Learn).
Microsoft’s examples give a sense of scale. In Microsoft’s Azure SQL Database example, a simple rule on a million rows uses about 0.02 DGPU per run on the Basic tier. If you run 100 of those in a day, that’s 2 DGPUs. At the Basic list rate of $15 per DGPU on the Azure pricing page, that comes to about $30 a day. Harder rules, like table lookups, use more. The Standard and Advanced tiers cost more per DGPU.
There’s a second meter. Every table you add to a data product counts as a governed asset, billed per asset per day. You pay both meters for data quality, because any table Purview scores counts as a governed asset.
The schedule is the part to watch. Purview also turns on a weekly scan for each table by default, and hourly scans on large tables add up quickly. Our article on Microsoft Purview Pricing for Fabric: What You’ll Actually Pay walks through both meters with worked examples.
How to Start Measuring Data Quality in Fabric With Purview
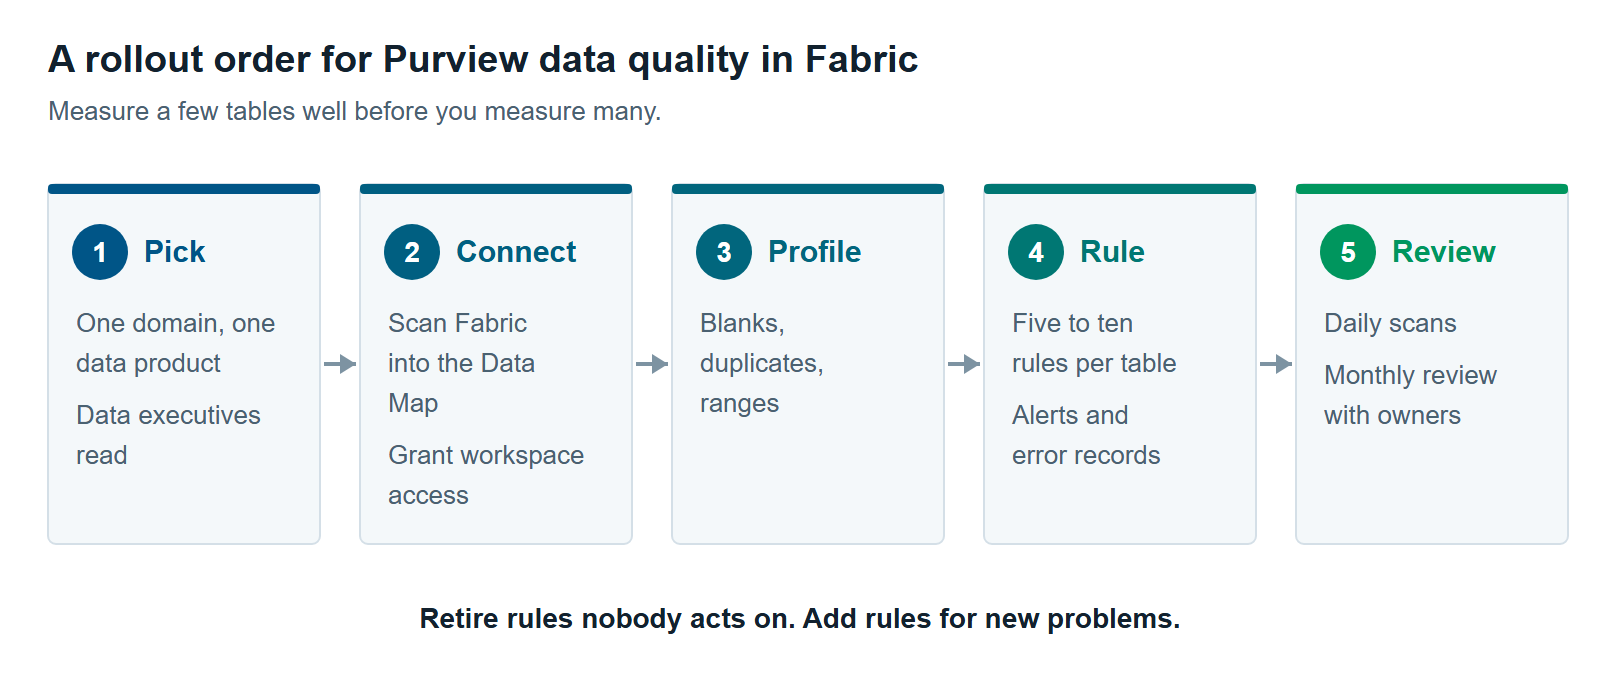
Start small, with the tables your leaders already rely on. A focused first round shows owners what a score is worth and keeps the bill predictable.
- Pick one governance domain and one data product. Choose the data behind a report your executives read every week.
- Connect Purview to the workspace. Scan Fabric into the Purview Data Map with a service principal, then give Purview’s managed identity Contributor access to the workspace.
- Profile the tables. Look at blanks, duplicates, and value ranges before writing any rules.
- Add five to ten rules per table. Start with Purview’s suggested rules, then add the business rules owners care about most.
- Turn on error records and alerts. Point the failed rows to a lakehouse, and set thresholds on the tables that matter.
- Schedule daily scans. Move to more frequent scans only for tables that change often and matter a lot.
- Review scores with the owners each month. Retire rules nobody acts on, and add rules for new problems.
Data quality is one part of Microsoft Purview for Fabric: A Practical Guide to Securing and Governing Your Data. Our Microsoft Fabric consulting team can help you choose the first data product and its rules.
When Purview Data Quality Isn’t Worth It Yet
Purview data quality isn’t worth it yet if nobody will act on the scores. A score with no owner is just another dashboard. It also may not be worth it if your quality problems are inside the pipeline itself.
Wait, or start with pipeline tests, if these are true:
- Nobody owns the data. Scores need a business owner who will chase fixes. Assign owners first.
- Your problems are load failures. Missed files, broken joins, and schema changes are best caught in the pipeline, where a test can stop the load.
- Your critical data lives in a Fabric warehouse. Warehouses aren’t on Purview’s supported-source list for data quality today.
- One team builds and uses the data. Fabric’s own tests and a short checklist may be all you need.
When owners want a score they can show their leaders, Fabric data quality Purview checks become worth the setup. Start with one data product and grow from there.
Further reading
- Data quality in Microsoft Purview Unified Catalog — features, life cycle and limits
- Data quality scores in Unified Catalog — how scores are calculated and rolled up
- Data quality error records — where failed rows go and how to read them
- Data quality in materialized lake views — Fabric’s own constraints for pipeline tests
Pavan Malpani is the Fabric Practice Delivery Lead at XTIVIA. Talk to us.